GS Paper III — Economy, Sci-Tech, Environment & Security
Economy, agriculture, science & technology, environment, disaster management, internal security.
General Economy
Topper handwritten notes#Page 1 — Overview: Indian Economy, Key Data, Financial Sector
#General Economy — Key Macro Data
- 3.05 trillion nominal economy (4th [rank])
- 10 trillion by PPP (#3 in the world)
- GDP pc [per capita] = $2191
- External debt = 558 bn; Forex reserves = 579 bn
- Public debt = 89% (after pandemic); earlier → 72%
- #FCCF [Fiscal Counter-Cyclical Framework / Fixed Capital Formation]
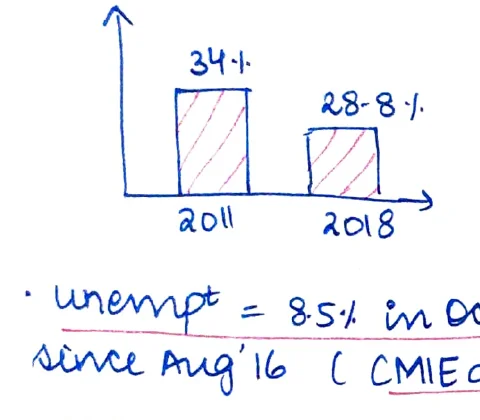
- Bar chart shows FCCF: 34% in 2011 falling to 28.8% in 2018 (x-axis: 2011, 2018; y-axis: percentage)
#Right Column — PCR, Quotes & Data Points
- PCR [Provisioning Coverage Ratio] — Yeshwant Deosthale [Deosthali] ©
- 10% ↑ in new firms in a district = 2.8–4% ↑ in GDP (ES [Economic Survey] 20)
- Mega corporations of today were startups of yesterday
- "No crony, phone a loan" — [reference to corporate governance]
- [illegible Hindi/abbreviation: अरेटा?] also talks about minimum wages
- ↑ Anoop Satpathy © [illegible date] 2019
#World Bank Research
- WB research proves that countries that improve 10 points on EODB [Ease of Doing Business] create an add'l [additional] 60 new businesses per 1L [lakh] pop
- → EODB for "clues" leads to following for "masses"
- 1.41 lakh cr. revenue from GST in April 2021 → record high
#Employment Data (PLFS [Periodic Labour Force Survey])
- emp [employment] data = PLFS
- 40.1% LFPR [Labour Force Participation Rate] (PLFS 2019-20)
- 4.8% unempt [unemployment]
- 52 cr. [crore] = workforce
- 45% in agri
- ✓ 5.5% ↑ in FLFPR [Female Labour Force Participation Rate]
#Unemployment & Growth
- Unempt [Unemployment] = 8.5% in Oct '20, highest since Aug '16 (CMIE data)
- Idiosyncratic growth (ES) → "Missing Middle"
- Technical recession — B2B [two consecutive quarters] & 2 consecutive quarters in GDP
- K shaped recovery
- NEET category — ~30% [illegible] as per OECD
#Resources Tree / Classification
- Resources
- Human
- Natural
- Financial
- Govt ⑧ [Government revenue]
- Tax | Non Tax
- DT [Direct Tax] | IDT [Indirect Tax]
- Internal | External [borrowings]
- Tax | Non Tax
#Philip Curve
- Philip curve — Inflation ↑ · Unempt ↓
- PSBs [Public Sector Banks] — ES [Economic Survey]: 90% frauds, majority NPAs, ₹23 loss on ₹1 lent
- SO? ESOP consolidation → PSBN [illegible]; LAGE 3(?) [illegible]
#PM Jan Dhan Yojana
- PM JDY [Jan Dhan Yojana] — 44 cr. a/cs [accounts]; 1.45L [lakh] cr. deposits
- 9.3% of GDP = FD [Fiscal Deficit]
- Gross NPA ratio at SCBs [Scheduled Commercial Banks] = 7.5%
#Liquidity Trap
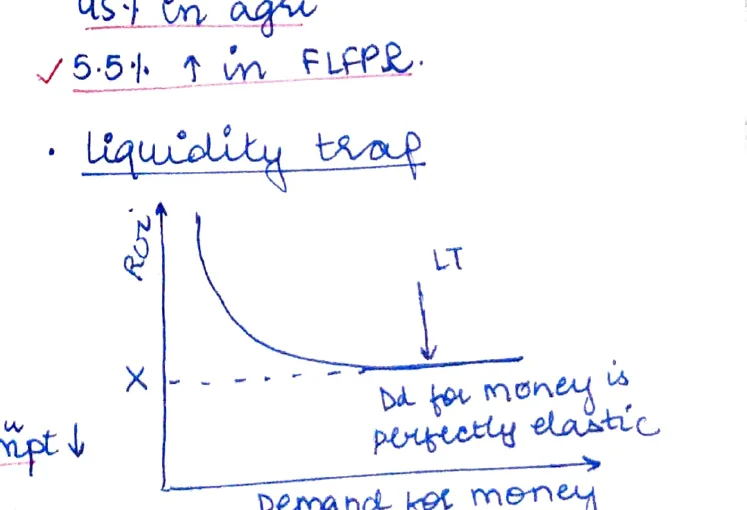
- Curve: y-axis = Rate of Interest (Roi); x-axis = Demand for money
- At interest rate X (minimum), LT [Liquidity Trap] kicks in — demand for money is perfectly elastic (flat curve)
- Monetary policy becomes ineffective; ↓ mpt [multiplier?]
#Page 2 — Employment Generation & Fiscal Management
#Employment Generation
- Food processing ↑ — Agro tourism
- Linkages with Agri & Services
- Startup India → Startup culture
- Labour intensive → Skilling
- FDI ↑ | ECOB [?] Mediation
#Employment Matrix (Diagram)
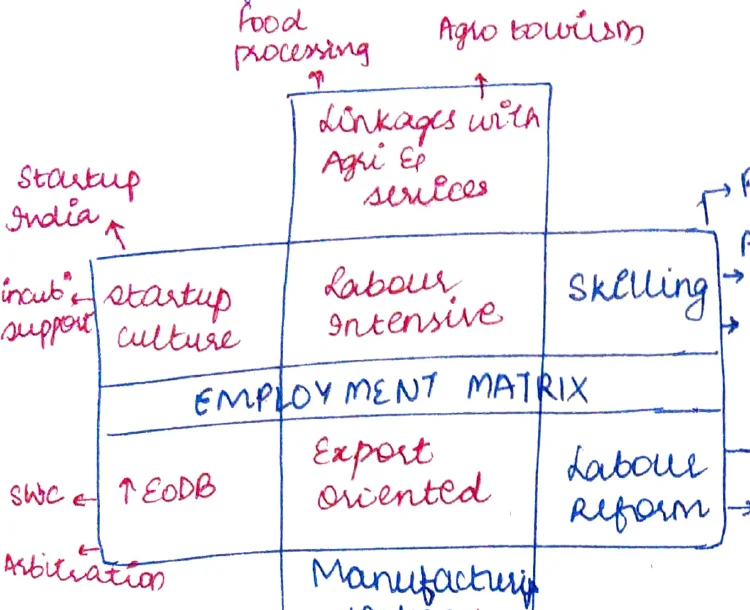
- Central node: EMPLOYMENT MATRIX
- Export oriented → Labour Reform → 4 codes; Labour MIS
- Manufacturing sector 100% → Tax incentives; PLI [Production Linked Incentive]
- Startup culture → Labour intensive → Skilling → PMKVY [Pradhan Mantri Kaushal Vikas Yojana]
- Food processing ↑ → Agro tourism → Apprenticeship Promotion, Vocation educ [education]
#National Employment Policy
- ⇒ Nat'l Employment Policy
- NK Singh headed 15th FC [Finance Commission] → Fiscal Mgmt [Management]
#Informal Sector
- → 90% of GDP
- → 90% of empt [employment]
- → rural areas
- → 24 cr. [crore] informal workers into decent livery [livelihood] in I. [India] due to C-14 (ILO R&B [Recommendation])
- → large presence of female CEOs [illegible]
#PLFS 2019-20
- unempt → 3.8%
- LFPR → 38.2%
- LFPR → 40.1%
- agri → 40% [illegible]
- 1% of last year
#21st Century Fiscal Architecture (Diagram)
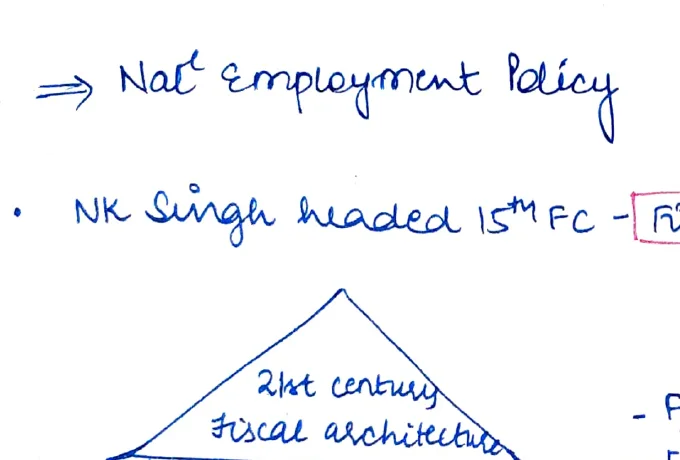
- House diagram: Roof = Information Tech
- Pillars:
- Fiscal Rules
- Public Finance Management [PFM]
- Independent Fiscal Oversight
- Accrual System
- [IFO — Independent Fiscal Oversight]
- Pillars:
- FO [Fiscal Oversight] — 4% by 2025-26
- Extra borrowing of 0.5% to states during 1st 4 yrs [years]
- Comprehensive public finance management fro [framework?]
#Fiscal Mgmt & PFMS Diagram
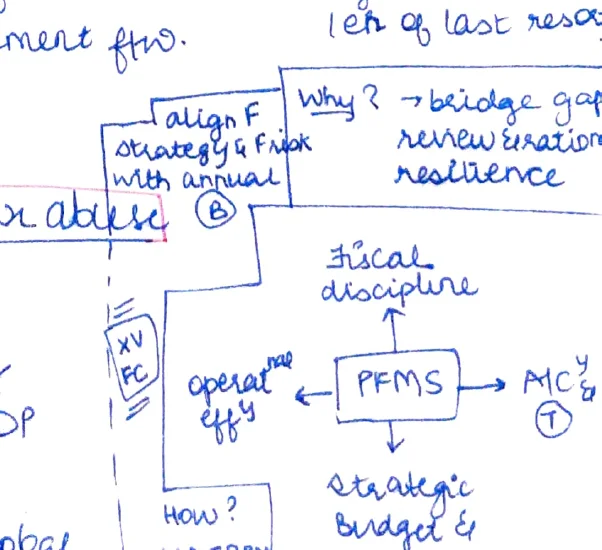
- Align Financing → [arrow to] Countercyclical resilience
- Local ecosystem? → PFMS → MC [Ministry/Controller?]
- [arrow] → Citizen's budget & planning
#Tax Loss to India due to Global Tax Abuse ⑧
- Equivalent to 0.41% of GDP
- $10.31 Billion
- $8 per member; 9 ppp? [PPP] = [1 billion?]
- Greater than regional avg of 0.38% of GDP
- Less than global avg of 0.53%
#Page 3 — Manufacturing, Labour & Sector-Specific Data
#Manufacturing & Labour
- 39% of GDP = 16%[?]; 26% workforce = 15%
- I [India] ranked 3rd in list of most suitable locations for global mfg [manufacturing] — Global Mfg Risk Index, 2020
- Make in India: 25% GDP by 2020; 100mn [million] new jobs
#MSME [Micro, Small & Medium Enterprises]
- 30% to GDP (mfg + services)
- 45% of mfg GDP
- 40% of exports
- 80% jobs in industry with just 20% [illegible]
- 2nd highest empt [employment] after agri sector (110mn)
#MSME Size Breakdown
- 99% are Micro | 94% are Unorg [unorganised] | 32% in mfg; 68% in services | 55% in rural
#COVID-19 Impact on MSMEs
- Covid 19 → 111 avg operations; 56% produced output
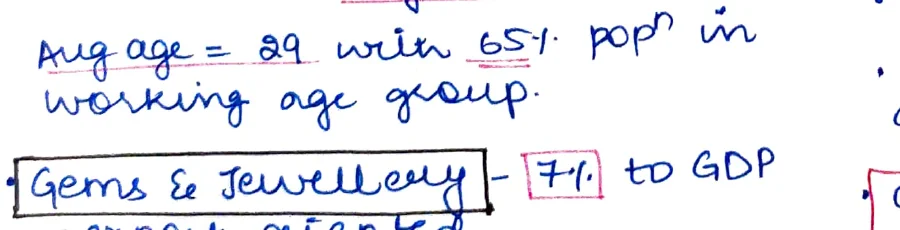
- In next 20 yrs., labour force in industrialised world will ↓ by 4%; India will ↑ by >30%
- Avg age = 29 with 65% pop'n in working age group
#Food Processing
- CAGR = 7% pa [per annum]
- 1.6% to GDP
-
10% to exports
- 40% of unempt [unemployment reduction]
- 1.6% of world trade
#Electronics
- 3.5% of GDP
- CAGR of 25% in last 4 yrs
- Domestic Prod'n [production] has doubled from ₹30bn → 2014-15 to ₹70bn → 2018-19
- I's [India's] share ↑ from 1.3% to 3% in 2018 in global mfg
- 45% of current demand through exports [imports?]
#Automobile
- 7% to GDP
- 4th largest mkt [market]
- Largest mfg [manufacturer] of 2/3 wheelers + tractors
- 37mn [million] employed
#Logistics Cost
- 14% of GDP [logistics cost]
#Empowerment through Entrepreneurship
- Command & Control → Plug & Play
- Atmanirbhar Bharat
#Share in World Trade (Table)
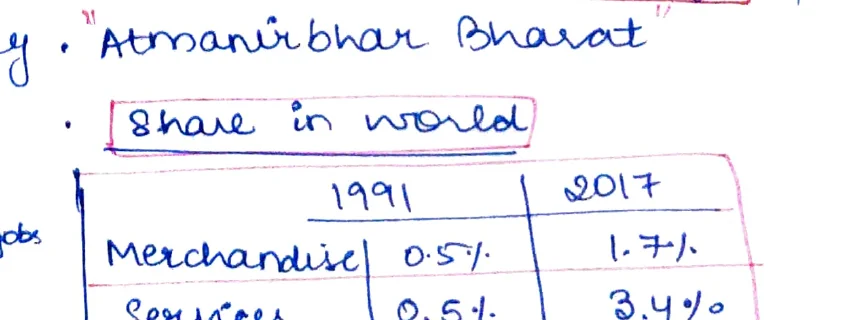
| Category | 1991 | 2017 |
|---|---|---|
| Merchandise | 0.5% | 1.7% |
| Services | 0.5% | 3.4% |
#Assemble in India — ES19 [Economic Survey 2019]
- 4 cr. [crore] jobs by 2025
- 8 tr. [trillion] by 2030
#Gems & Jewellery
- 7% to GDP [illegible box]
- Export oriented, Labour Intensive
- 11/12 diamonds in any jewellery in world are cut & polished in I. [India]
#Textile
- 2% of GDP
- 15% of exports
- 2nd largest textile fibre producer
- 2nd largest exporter of textiles + 2nd textile mfg capacity
- 5% share in global trade
- ESG [?] for ↓ (5%) in textile → oil jobs [?]; 1% in technical → 70 jobs [job creation stats]
#Page 4 — Taxation: Low Tax-GDP Ratio & GST Federalism
#Low Tax to GDP Ratio — Root Cause Mind-Map
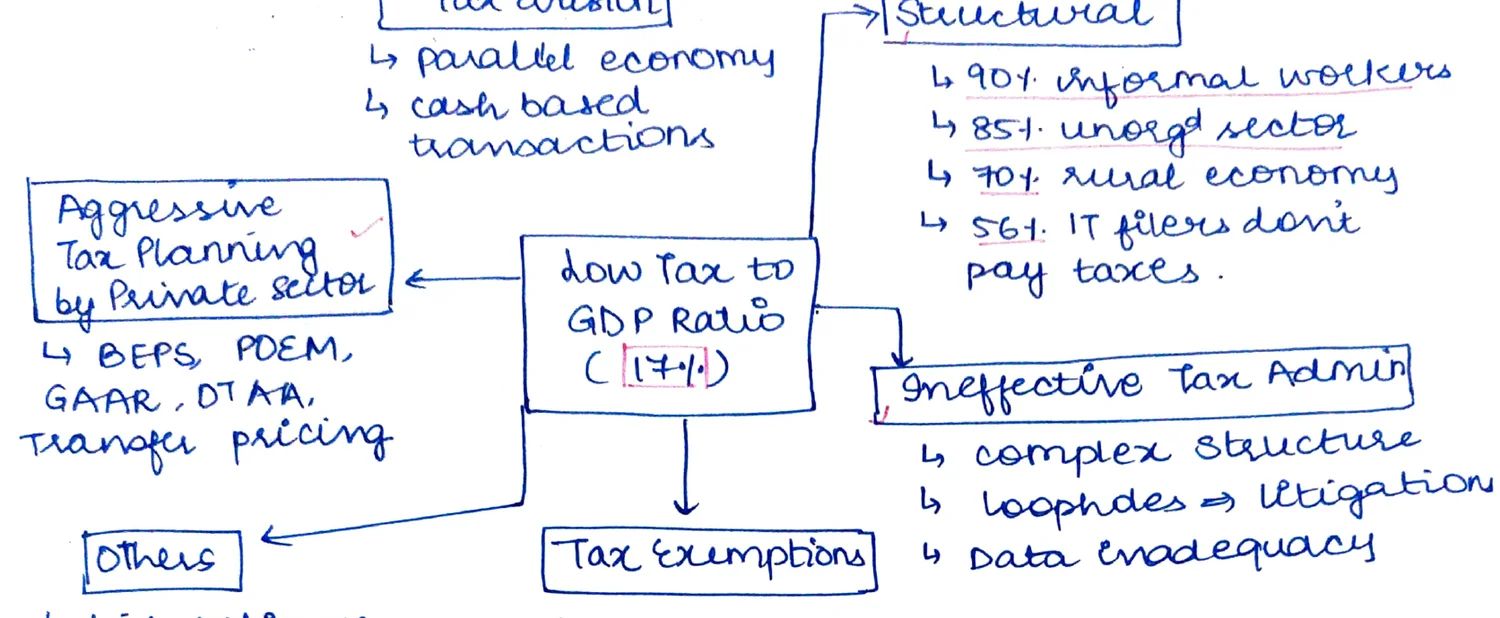
- Central issue: Low Tax to GDP Ratio (14%)
- Tax Evasion
- Parallel economy
- Cash-based transactions
- Aggressive Tax Planning by Private Sector
- BEPS [Base Erosion & Profit Shifting], POEM [Place of Effective Management], GAAR [General Anti-Avoidance Rule], DTAA [Double Taxation Avoidance Agreement], transfer pricing
- Structural
- 90% informal workers
- 85% unorg [unorganised] sector
- 70% rural economy
- 56% IT filers don't pay taxes
- Ineffective Tax Admin
- Complex structure
- Loopholes → litigation
- Data inadequacy
- Others
- High reliance on indirect taxes
- Fluctuating economic growth
- Tax Exemptions
- 4.5% of GDP (> fiscal + no agri income deficit) tax
- Corporates = 15%
- Low effective tax rate on Super Rich
- Tax Evasion
- ✓ I [India] has one DT payer for every 16 voters
- OECD = 34%
#Steps Taken
- Transparent Taxation Platform — faceless assessment, charter [for] taxpayers
- Revised form A/R&AS [?]
- Ease of compliance — pre-filled form
- Rationalise tax slabs — R21 [?] for corporate (15% for new mfg units); zero tax upto ₹5L for ind [individuals]
- E-Nivaran → ARM [Alternative Resolution Mechanism?]
- ↓ in scrutiny by at least 4 times in last 6 yrs.
- Reduce legal burden — Vivad se Vishwas — DT; Sabka Vishwas Scheme — IDT
- ✗ Tax Information Network (Vijay Kelkar ©)
#DT [Direct Tax] Contribution
- DT contrib'd ↑ from 60% in 2010-11 to 52% in 2017-18; ↑ in IDT [Indirect Tax]
- IDT is good as it is regressive in nature
#Pre-GST vs Post-GST Fiscal Federalism
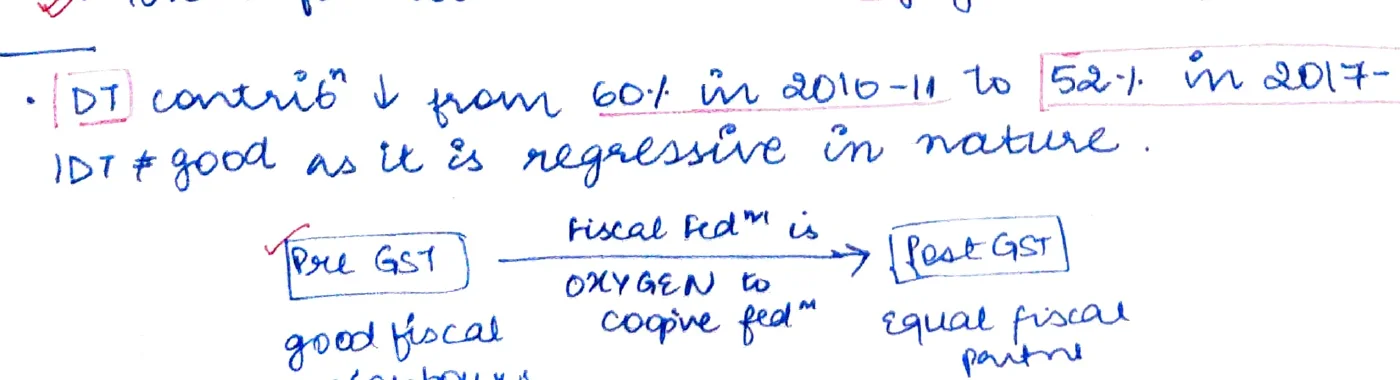
- Pre GST → fiscal fed'n [federalism] in OXYGEN to [illegible]; good fiscal neighbours
- Post GST → equal fiscal partners
- ↳ Vijay Kelkar [quote]
#Page 5 — Manufacturing Sector Challenges & MSME Issues
#Mfg Sector — China Plus One Strategy
- "China plus one" strategy
- #2 economy → sept PPP [?]
- Yet only 2% of world mfg [?]
- Since the IR [Industrial Revolution], no country has become a major economy without becoming an industrial power — Lee Kuan Yew
- Stagnated at 16% for past 30 yrs. [years] boz [because]:
- Infra & logistics — transport, power, warehousing
- Restrictive labour laws → Informal sector (~90%); Capital Intensive Industries
- Skill mismatch
- Domination of small firms & low prod'y [productivity] (MSME Dwarfism)
- Complicated business envt [environment]
- Inadequate exp. [expenditure] on R&D & Innov'n — (0.7% of GDP) — Pvt sector MCs [Multinationals] for only 35% compared to 70% in China
- Slow tech adoption (Tech fatigue)
- Export challenges — operates at low end of mfg value chain + stiff competition (Bangladesh/Vietnam → apparel; Indonesia/"" → leather)
- #Real 9. Tax & Tariff
- No capital access — NPA, ECB limits, FDI in big firms [?] only
#SO? [Solutions]
- Equal focus on FOBB [?] & Cost of Doing Business
- 4th IR [Industrial Revolution] — digital infra → Innov'n ecosystem → Smart mfg
- R&D ↑
- Focus on high value sunrise industry & MSME
- Strategic Sneg'y [synergy] with GVCs [Global Value Chains]
- Best [skilling] & gainful empt
#MSME Issues
- Policy envt [environment] not conducive to growth
- Dwarfism due to perverse incentives (99% are Micro)
- Difficult entry (12 procedures / 37 days)
- Exit norms (Insolvency in 7–9 yrs. — WB [World Bank])
- Complex compliances etc
- Small size, 40 infra & outdated tech
- No economies of scale
- Low quality
- No adequate credit & capital — only 4% have access to formal credit due to:
- Inadequate collateral
- Low asset recovery rate (14%)
- Complex loan procedures
#Page 6 — MSME Solutions, 5F Formula & 3R Approach
#MSME — Further Issues (continued)
- Ltd [Limited] access to Mkt [Market] & Info [Information] services
- Skills & capacity
- Inadequate social security net — 94% in unorg [unorganised] sector
- MSME clusters
- No awareness
#Way Forward — SCALE
- Sense of Security
- Credit
- Access to mkt
- Leverage Tech
- EODB [Ease of Doing Business]
#UK Sinha Report
- MSME code
- Turnover based defn [definition] — accepted
- Business Asset Fund (₹50,000 cr.)
- Estt. [Establishment] Enterprise Dev' Centres (for CBM [Capacity Building & Management])
#Raj Case Study of Boosting MSME [margin note]
#Initiatives So Far
- Public procurement (95%); PMEGP (CLS); MUDRA; PSB Loan 59 minutes (4000 Cr.); TREDS [Trade Receivables Discounting System]; CGTMSE [Credit Guarantee Trust for Micro & Small Enterprises] (credit flow ↑); Udyog Aadhaar; SPURTI; Lean Mfg Competitive Scheme; ASPIRE; ZED [Zero Defect Zero Effect]; Digital MSME; Udyami Mitra; MSME Sambonh [Sambandh?]; Samadhan
#5F Formula (Ujjwala) — Flow Diagram
- Farm → Fibre → Factory → Fashion → Foreign
- Nodes connected in a chain with arrows showing value chain progression
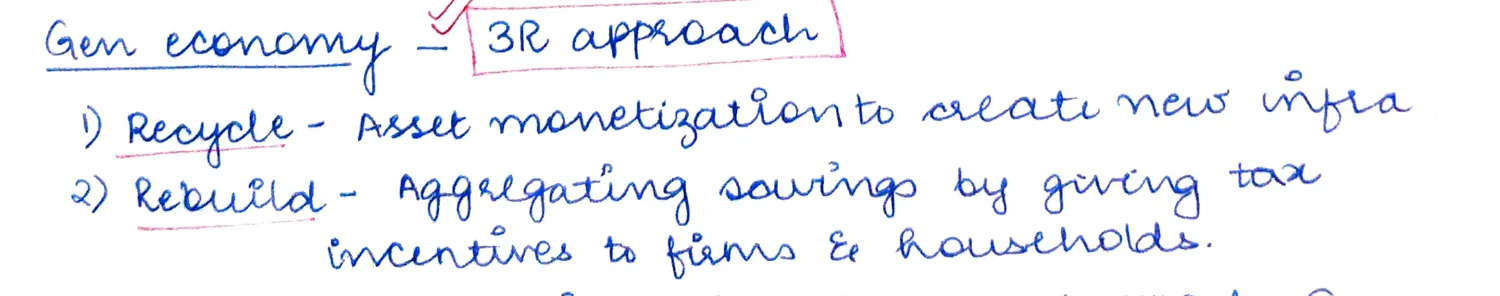
#Gen Economy — 3R Approach
- Recycle — Asset monetization to create new infra
- Rebuild — Aggregating savings by giving tax incentives to firms & households
- Reinvest — To achieve self reliance, ↑ exports & attain sustainable growth
#Page 7 — Jobless Growth, Vehicle Scrappage, Coal Crisis, ONORC, Corporate Banks
#Jobless → Job Loss Growth
- Economy losing its ability to absorb new entrants
- 2004-05 → 58%
- 2011-13 → 15%
- 2017-18 → −5%
- Loss of jobs — 6.8mn lost during 2011-17; worsened during Covid
- Impact on marginalised — poor & women
- Informal sector empt ↓ due to "demonetisation", GST & then C-19
- CMIE — 1Cr [crore] due to Covid
- Max job losses in agri / mining / quarrying
#Vehicle Scrappage
- 5th largest 4-wheeler mkt
- 51 lakh vehicles → >20 yrs old
- 34 lakh vehicles → >15 yrs old
- (+) Circular economy; Govt revenue ↑ (40,000 cr in GST); Infra [contribution]
- (-) Fitness certif.; incentives to be provided by states
- Savings; geo-pol adv. [advantage] → AATMA [Atmanirbhar?] (recycling hub); Atmanirbharte; Atma Industry
#Coal Crisis (REA Guidelines of 22 day stock) — Sept 2020
- Immediate causes — Chinese dec't [decline?] from SE Asia [?] (like Indonesia, India's leading supplier)
- Post pandemic dd [demand] ↑
- No planning for floods
- Export prices more than doubled
- Renewable add'n [addition] slowed down — only 74% added in 2020-21
- Systemic causes (2014, 2018)
- Debt burden & dampened Invt [Investment]
- Saukbaaqa [illegible]
- Mining monopoly (CIL + SCO [?])
- Operational / logistics
- Rising pressure on domestic coal due to import substitution
- Impact? → eco recovery ↓ → inflation
- ↑ oil prices → spot price of power?
#FPO [Farmer Producer Organisation]
- Central sector scheme — 10,000 FPOs
- Support by SFAC [Small Farmers' Agribusiness Consortium]
- 86% S&M [Small & Marginal] landholding
- → bargaining power
- → fragmented land
- → economies of scale
- → enable mechanism
- → ease of credit accessibility
- → better price realisation
- → cluster based approach
- → facilitates organic farming
#ONORC [One Nation One Ration Card]
- 37% internal migrants
- (+):
- Interoperability
- Choice ↑
- SDGs [Sustainable Development Goals]
- Integration / synergy
- Corruption, bogus cards ↓
- Central data repository
- (−):
- Exclusion error
- Logistics
- 4G data
- Cost of addl [additional] food grain
- Tech challenges
- States' resistance
- Hijacking of state schemes by Centre
#Corporate Houses as Banks
- Domestic bank credit to pvt sector is just 50% of GDP (>150% in S. Korea, US, China, Japan)
- NPAs of PSBs
- Growth needs of country
- 100 cr. for infra [illegible]
- (−) COI → interconnected lending
- (−) Evergreening of loans
- (−) Concentration of eco power (1AB [?])
- (−) No effective supervision by RBI (only, export [?])
- (−) Deposits of public = public safety net, still to be provided by govt.
- (−) yes/Bo [?] DHF [?]
#Page 8 — Inclusive Growth, MGNREGA, Urban MGNREGA, Export Performance
#Banking Governance Quote
- "If you owe your bank a 100 pounds you have a problem but if you owe your bank a million pounds, it has." (NPA/Banking governance)
#PPP & Growth Quote
- "If India does not harness the potential of PPP for its growth, it will grow old before it becomes rich." — Vijay Kelkar ©
#Growth Quote
- "Economic growth means nothing unless it's inclusive growth" — John Green [?]
#HDI & Inequality
- 28.6% of I's [India's] HDI value is lost on a/c [account] of inequalities
- A country is poor because it is poor (vicious cycle)
#Sankalp se Siddhi
- Ease of Living Index
#Ease of Living / SDG Pie Chart
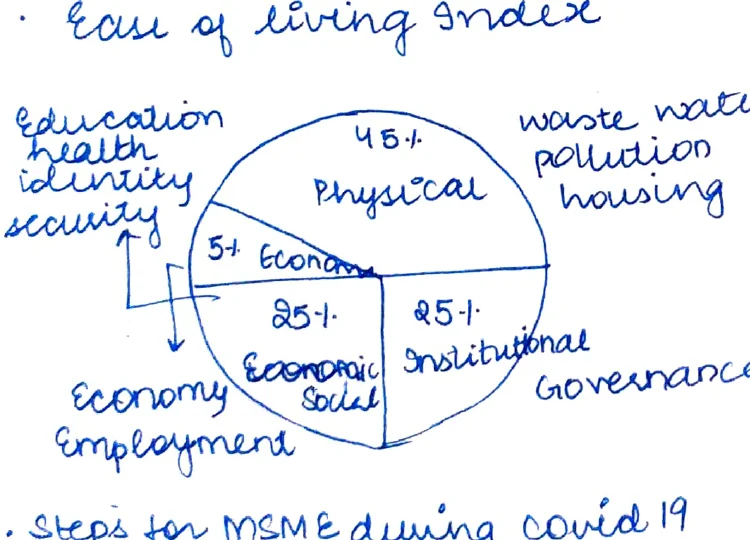
- Pie chart segments:
- 45% Physical (waste water, pollution, housing)
- 25% Economy / Economic
- 25% Institutional / Governance
- 5% Economy [?] (social)
- Connected to: Education, Health, Identity, Security
#Steps for MSME during Covid-19
- ₹20,000 cr. subordi [subordinate] debt
- ₹3L [3 lakh] cr. automatic loans / collateral-free
- ₹50,000 cr. equity infusion through MSME fund of funds
- Revised criteria
- No global tenders for procurement upto ₹200 cr.
#COVID-19 Statistics
- CMIE — 1Cr [crore] people lose jobs during lockdown
- Oxfam — Billionaire wealth ↑ by 35% during the pandemic
#Urban MGNREGA
- Why? → Covid had exposed structural weaknesses
- ~30% pop[ulation] but largely invisible for want of docs [documentation]
- 70% of social protection benefits are in rural India
- PLFS (2017-18) — unempt is higher in U (7.8%) than R (5.3%)
- Low wage, poor quality, informal work
- Prevent reverse mig'n [migration] & consequent pressure on rural economy
- +ve spillovers → dd [demand] ↑ training, assets / public goods
- e.g. MP → Yuva Swabhiman Yojana; Kerala since 2010; Jharkhand too.
#India's Export Performance
- Export Preparedness Index 2020 — avg score of 39 out of 100
#Challenges
- External factors (last me [illegible])
- Narrow export basket — 20/99 [products/countries]
- Product groups A/c for 80% exports
- No mkt diversif'n & penetration in high income countries
- Logistics ineffy [inefficiency] (14% → NIT [?])
- Sm [Some] protectionism
- Quality & competitiveness
- Failure to tap the potential of FTA [Free Trade Agreements]
- Low mktng [marketing]
- Primary & low tech goods
#Export Initiatives Diagram
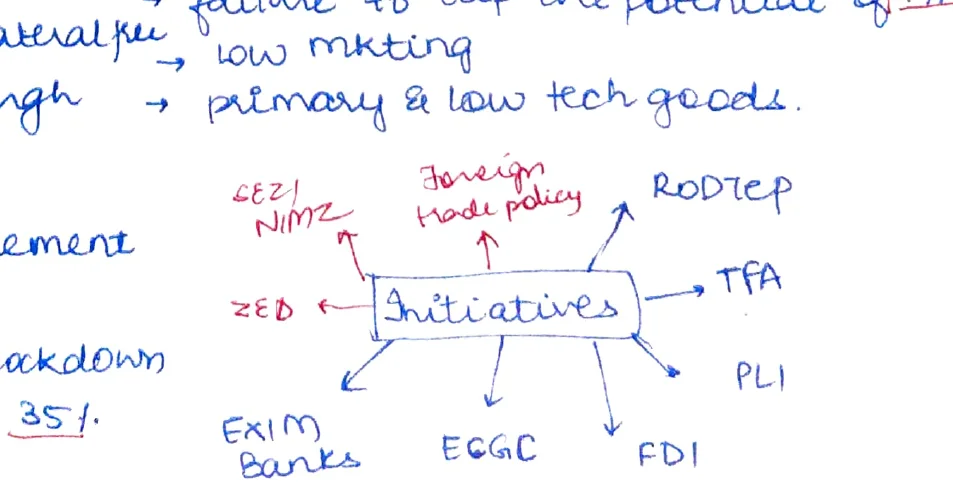
- Central node: Initiatives
- → SEZ [Special Economic Zones]; NIMZ [National Investment & Manufacturing Zones]
- → Foreign Trade Policy
- → RODTEP [Remission of Duties and Taxes on Exported Products]
- → TFA [Trade Facilitation Agreement]
- → PLI [Production Linked Incentive]
- → Exim Banks
- → ECGC [Export Credit Guarantee Corporation]
- → FDI
#Page 9 — Energy: Production, Issues & Government Steps
#Energy — Overview
- 3rd largest producer
- 3rd largest consumer
- 5th largest installed capacity
#Energy Mix
- Thermal — 63%
- Hydro — 18%
- Nuclear — 2%
- Renewable — 29% (5th largest)
- Wind > Solar > Bio > Small Hydro: 43 : 40 : 11 : 6 (GW)
#Transmission & Distribution Losses
- T&D Losses = 18–20% in India; 8% avg in world
#Global Comparisons
- India per capita consumption of electricity is 1/3rd of global avg; 1/11th of USA
#Oil
- 3rd largest consumer
- 4th largest refiner
- Net exporter of refined oil
- 80% imports (2018)
#Clean Cooking
- IEA, 2018 — 53% of India's pop'n did not have access to clean cooking in 2017
- LPG coverage ↑ from 55% in 2014 to 97% — praised by IEA
#Energy in Various Indices
- Energy = highest share in IILL [illegible]; NIP + 100% FDI
- SDG 7 — 750mn [million] people gained access BW [between] 2000 & 2019
- Net exporter of electricity to Nepal, Bangladesh, Myanmar
#Energy Policy Quotes
- Annadata to Urjadata — PM KUSUM [Kisan Urja Suraksha evam Utthaan Mahabhiyan]
- Energy poverty → Energy for prosperity
- ISA, OSOWOG [One Sun One World One Grid]
- "Modernise, w/o the need to carbonise" — Greenkation? (Green tax)
#Issues — Faulty Def'n [Definition] of Electricity?
- 177% rural HHs [Households] suffer due to this [definition issue]
- Inter-state disparity — SS [surplus states] have power surplus
- Poor access due to (~300mn):
- Poor afford'y [affordability]
- Poor availy [availability]
- Poor quality — 53% villages for <12 hrs a day
- Inadequate Infra
- Unmetered connections
- No GW [gigawatt?] from diesel gen → Envt [Environmental] issues
#Causes
- Stalled power projects
- Rising NPAs — 34 stressed TPPs [Thermal Power Plants] with 1.74L [lakh] cr. debt O/S [outstanding]
- Nuclear power not tapped
- Tariff inadequacy — populism
- Suboptimal impact of govt schemes
- Cross subsidy
- Inability to attract FDI
- "Our gateway to a prosperous future" — APJ Abdul Kalam
- 2–4% from #95; 10% globally [?]
#Govt Steps
- UMPP [Ultra Mega Power Projects] — 4000 MW
- Pvt'n [Privatisation] of coal mining
- SHAKTI [Scheme for Harnessing and Allocating Koyala Transparently in India]
- PRAKASH [Power for All]
- UDAY [Ujwal Discom Assurance Yojana]
- Renewable energy
- DDUGJY [Deen Dayal Upadhyaya Gram Jyoti Yojana] — 100% village [electrification]
- IPDS [Integrated Power Development Scheme] for urban areas
- Saubhagya
- Power for all
- Smart meters
- Nat'l Tariff Policy, 2016
#Page 10 — UDAY, Logistics, Energy Dilemma, Tourism, Inland Water Transport
#UDAY — Line Graph
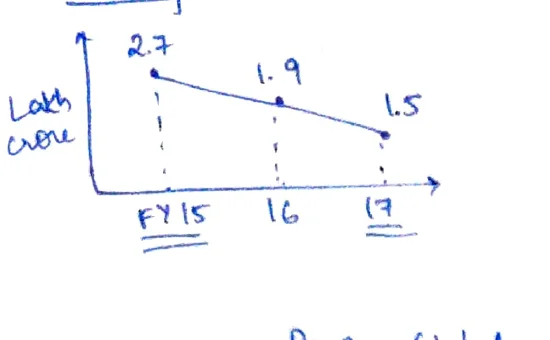
- Line graph: y-axis = Loan (units); x-axis = Years (FY15, FY16, FY17)
- Loan curve: 2.7 (FY15) → 1.9 (FY16) → 1.5 (FY17)
- Debt of DISCOMs shown
- Annotations: poor final health + high rate of subsidies
- "Less Avg billing rate" → Travel DISCOMS [?]
- Borrowings to make up losses; Low competitiveness of corporates; High rates from private [?]
#Logistics (Industry Overview)
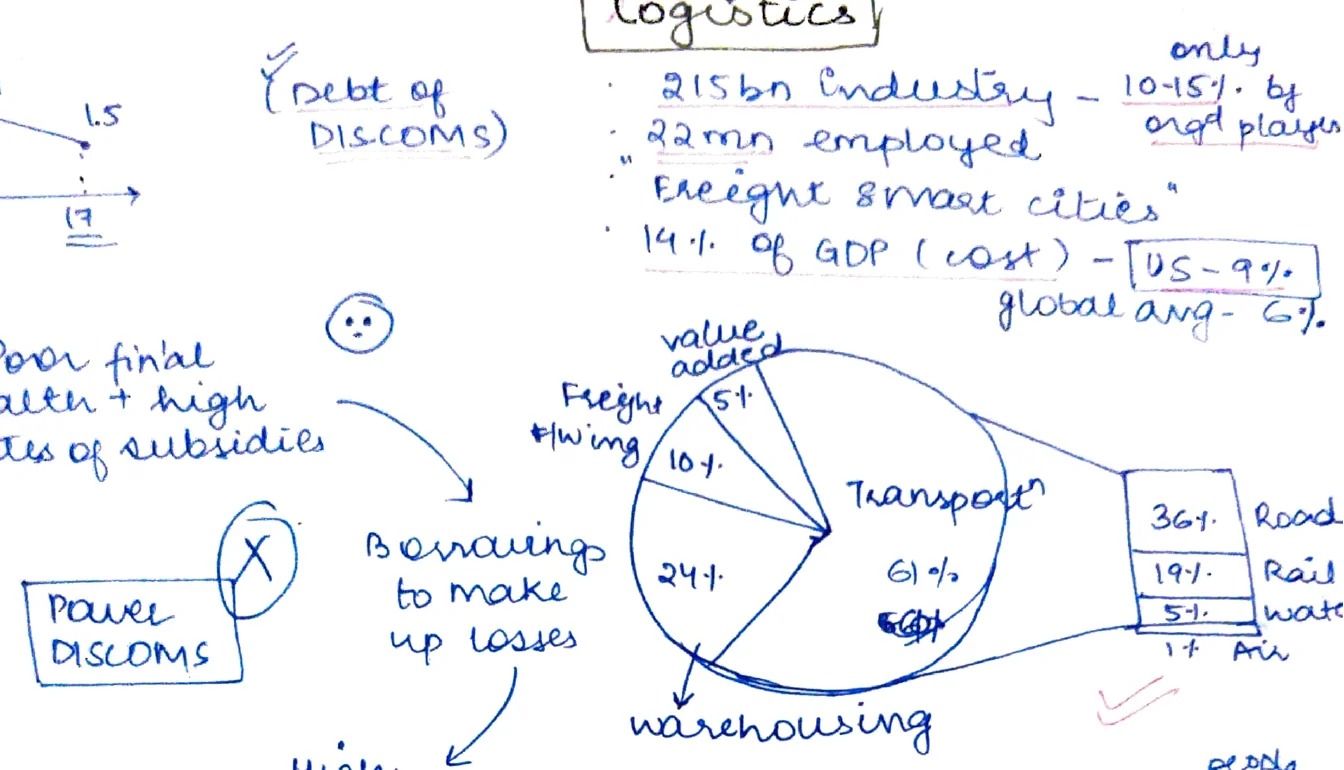
- ₹215 bn industry — only 10–15% by organised players
- 22mn [million] employed
- "Freight 8 smart cities"
- 14% of GDP (cost) — [US: 9%; Global avg: 6%]
- Pie chart breakdown:
- Transport: 61%
- Warehousing: 24%
- Freight fwding [forwarding]: 10%
- Value added: 5%
- Transport breakdown (bar): Road 36% | Rail 19% | Water 5% | Air [1%?]
- 4.5L [lakh] road crashes — 1.5L die
- Taxpayer to [illegible] transfer; PPP [?] licensing [?] TTT
#Investment Models (Table)
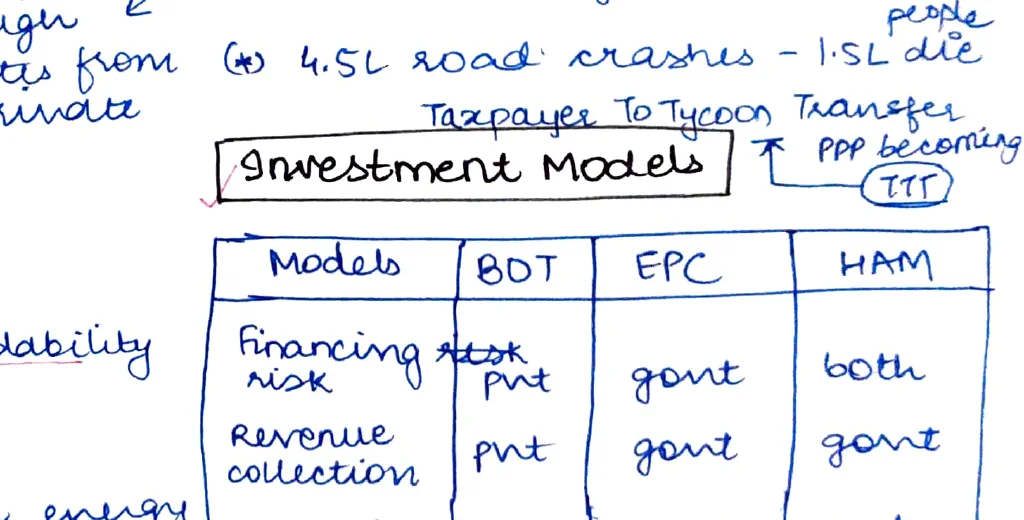
| Models | BOT [Build Operate Transfer] | EPC [Engineering Procurement Construction] | HAM [Hybrid Annuity Model] |
|---|---|---|---|
| Financing risk | Pvt | Govt | Both |
| Revenue collection | Pvt | Govt | Govt |
| O&M [Operation & Maintenance] risk | Pvt | Govt | Pvt |
- PPP [Public Private Partnership] = sharing of:
- 40% Revenue
- Risk
- Risk + Resources (?)
- Venn diagram: BOT ↔ EPC ↔ HAM (HAM bridges public & private financing)
#Energy Dilemma (Triangle)
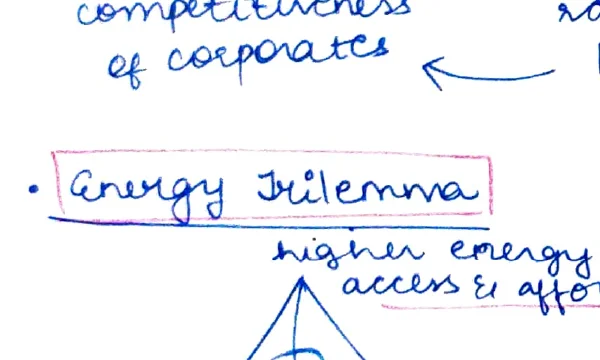
- Triangle with 3 vertices:
- Higher energy access & affordability
- Higher energy security
- Higher sustainability
- Central node: E [Energy] — tension between all three
#Tourism
- 5% of GDP
- 13% to empt [employment]
- 12th in forex
- PC [per capita] → ₹2mn [million] Invt [investment] in tourism generates 78 new jobs (Mtg [?] 18)
- Sustainable T [Tourism]
- One of targets in SDG 8, 12, 14
- Rural T; Medical T → SWOT
- MICE (Meetings, Incentives, Conference, Exhibitions)
- Make in India → Move in India
- Travel & Tourism Index → dot = 54th [rank]
#Inland Water Transport
- 14,500 navigable waterways
- <1% of freight traffic
- 30% in Bangladesh; 20% in Germany
- Cost curve [illegible] (curve diagram)
- "Arthganga" [Arth Ganga] (river of wealth) — map
- Map of [illegible waterway routes]
#Page 11 — Micro-Insurance, Transport Economics, Banking Structure, IBC, Circular Economy
#Micro-Insurance — 6 Pillars of Joy
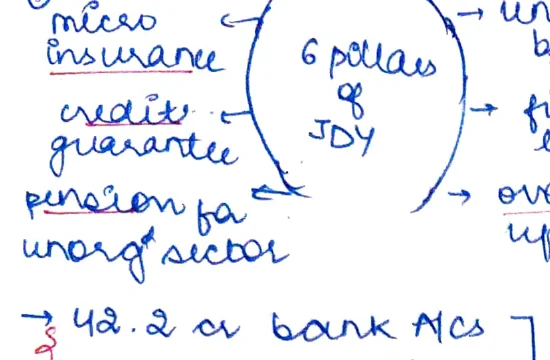
- Central axis: 6 pillars of JOY
- → Universal banking
- → Financial literacy
- → Overdraft upto ₹10,000
- Credit guarantee
- Pension for unorg [unorganised] sector / actor
- ₹43.2 cr. bank a/cs [accounts] as of March '21
- ₹1.45L [lakh] cr. deposits
#Cost vs Distance — Transport Modes Graph
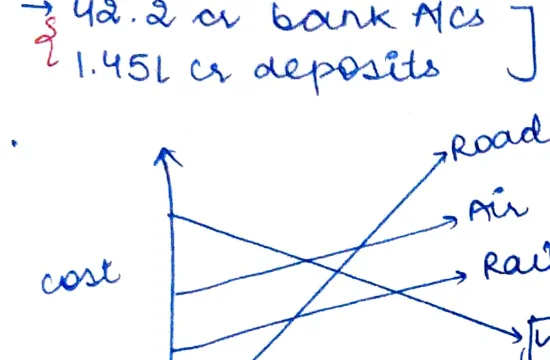
- y-axis = Cost; x-axis = Distance
- Lines:
- Road (steepest slope — highest cost per km at long distances)
- Air [second steepest]
- Rail (moderate slope)
- Water (lowest cost per km at long distances)
- Cross-over points show optimal mode for each distance range
#Narasimham Committee — Banks Pyramid
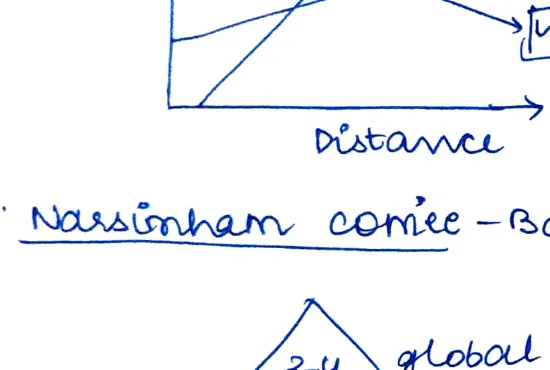
- Pyramid with 3 tiers:
- Top (3-4 banks): Global Banks
- Middle (8-10): National Banks
- [Rise tier]: Rise [?]
- Base: Local banks
- 3-tier structure
#IBC [Insolvency & Bankruptcy Code] — GN Bajpai ©
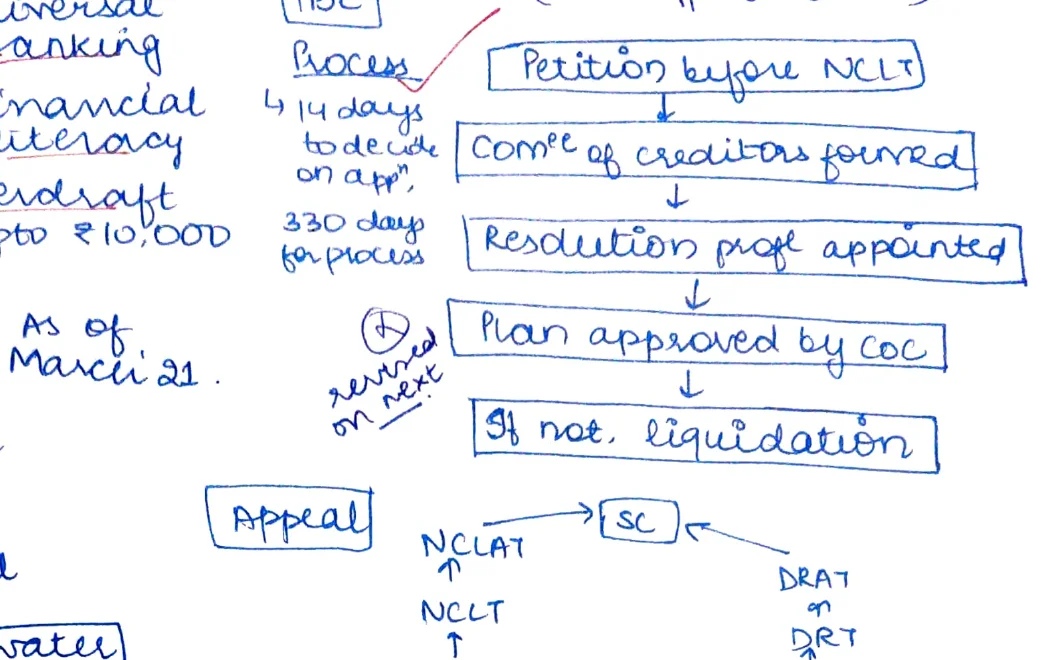
- Process (top flow):
- Petition before NCLT [National Company Law Tribunal]
- → CoC [Committee of Creditors] formed: 14 days? [illegible days]
- → Resolution profl [professional] appointed: 330 days [illegible]
- → Plan approved by CoC
- → Plan → [if] not → Liquidation
- OR → Resolution profl submits; CoC constituted; IP [Insolvency Professional] appointed
#IBC Appeal Hierarchy Diagram
- Appeal path:
- NCLAT [National Company Law Appellate Tribunal] → SC [Supreme Court]
- NCLT → DRAT [?] → DRT [Debt Recovery Tribunal] → [?]
- CoLLP → Gvt'y P'ship [?] [Government Partnership?]
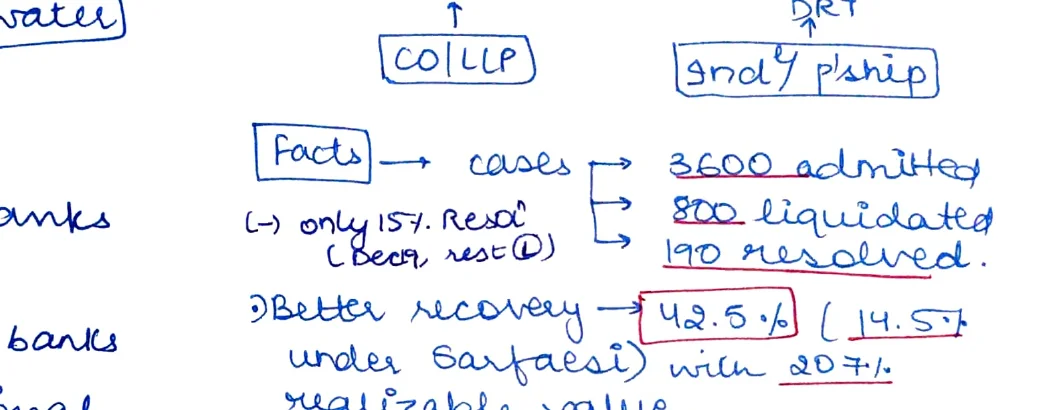
#IBC — Facts
- Cases → 3600 admitted; only 15% Reso'd [Resolved] (been most [?]); 800 liquidated, 90 resolved
- Better recovery — 42.5% (14.5% under Sarfaesi) with 20% realisable value
- Early settlement — 240 days against 4.3 yrs. earlier (success: not just ₹2mn but behaviour change)
- Self-empt [employment]
- 110 → 85% to I are self empt'd or casual workers
#Agri Domain — Issues
- (−) Agri domain (60%):
- Job creation is low — only 4% hire outside workers
- Low earnings — PLFS — ₹8000 pm [per month]
- Highest gender pay gap (men can 3x more)
#Labour Laws
- Labour laws should neither be unfriendly nor extremely friendly, but empt [employment] friendly
- "Inflation is taxation w/o legislation" — Milton Friedman
#Circular Economy Diagram
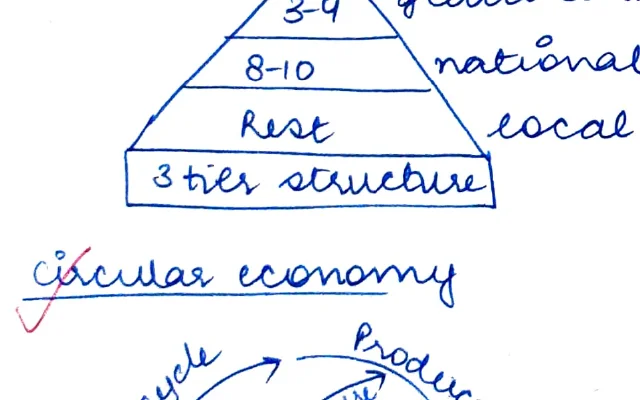
- Circular flow: Recycle → Produce → [Use] → Recover → [back to Recycle]
- Annotations:
- NIT [?] → 1.4 cr. jobs in 5-7 yrs.
- China's Batton town → 50% of all buttons on earth
- ₹1Gh [?] solar energy → 4000 direct + indirect jobs
#MGNREGA
- MGNREGA → ₹285 cr. / man day [illegible]
- Jobs: 18 per year? [illegible]
- Nat'l avg = ₹178/day (wage)
- Labour min → [illegible] = ₹375/day
- In nature [?], [illegible] = min [illegible]
#Page 12 — GDR/ADR, Bad Bank (NARCL/IRDCL), IBC, Railways
#GDR [Global Depository Receipts] / ADR [American Depository Receipts]
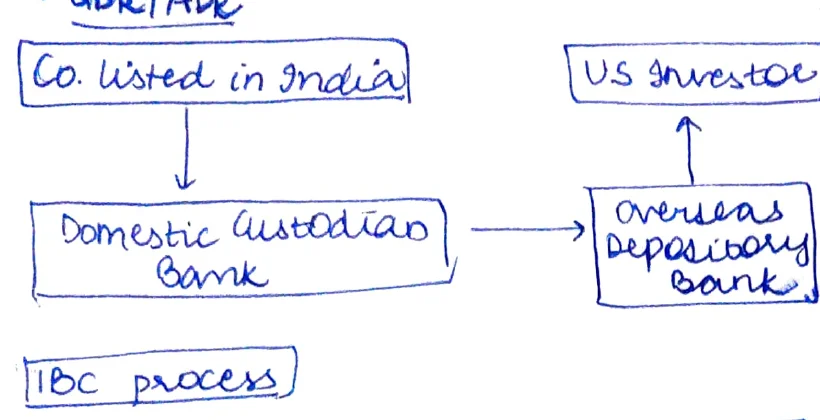
- Co. listed in India
- → Domestic Custodian Bank
- → Overseas Depository Bank (+ US Investors)
- → ADR [issued to US investors]
- → Domestic Custodian Bank
- Steps: Co. → Domestic bank → Overseas Depository Bank → [DR issued]
#NARCL [National Asset Reconstruction Company Ltd] / IRDCL [India Debt Resolution Company Ltd]
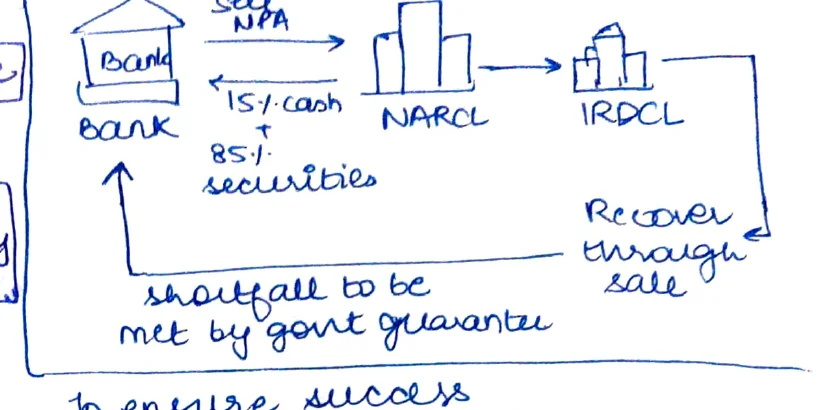
- Structure:
- Bank → 15% cash [payment to bank]
- → NARCL → acquires stressed assets
- → IRDCL [manages resolution]
- → Recover through sale
- Shortfall to be met by govt guarantee
- NPA/SRs [Security Receipts] → 85% securities
#IBC Process — Sub-Flow
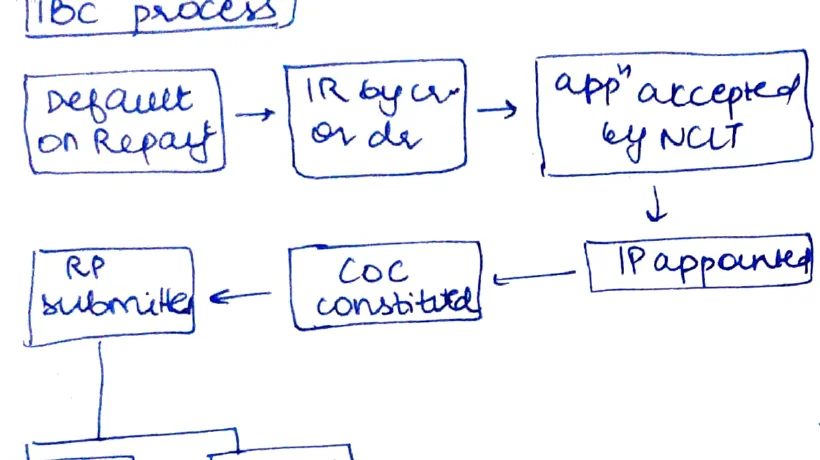
- Default on Repay't [Repayment]
- → IB [?] by / OR die
- → APP [Application] accepted by NCLT
- RP submitted
- → CoC constituted
- → IP appointed
- Resol'n [Resolution]: approve by G'1 [?]
- Liquid [Liquidate] if not approved
- (+) Time bound & mkt linked Resol'n
- → EODB
- → NPA crisis
- → Incentivise R over L [Resolution over Liquidation]
- → Easy [?] (Chakkravyuh challenge)
- → Investor confidence ↑
- → +++ Eco growth
#Bad Bank / NARCL / IRDCL — Details
- US: Mellon Bank; Sweden: Securum; ES [?]: 2016-17 → PARA [Public Sector Asset Rehabilitation Agency]
- NARCL → set up by banks (RBI = 51%); also acts as ARC [Asset Reconstruction Company]
- IRDCL → AMC [Asset Management Company] to sell [realise] assets; PSB-managed
- Govt → guarantee of ₹30,000 cr. (NARCL)
- (+):
- Cleaned up B/sheet [Balance Sheet]
- Unlocking capy [capacity?] (NPA — 45%)
- Credit creation
- Save taxpayers' money to recap [recapitalise]
- (−):
- Moral hazard (undue diligence by banks)
- Rekapuwan kapin? [illegible] mostly 4% of bank
- Doesn't solve systemic issues
- Delay in recovery
#To Ensure Success [of Bad Bank]
- Well capitalised ARCs
- Finite tenure to resolve NPAs
- Realistic valuation of NPAs (allow deep haircuts)
- Prof'l [Professional] expertise
- Reform PSBs
#Railways
- 4th largest n/w [network] in world
- 1.3mn [million] people employed
- Billet [Budget] delinking? [illegible]
#Why Pvt'n [Privatisation] Needed?
- Nat'l Rail Plan — 16.7L [lakh] cr. for Railway transformation
- DFCs [Dedicated Freight Corridors]
- Low efficiency — recovers only 57% of cost through tickets
- Tech advance'l [advancement]
- Quality of service delivery — IRTC [?]
#No Pvt'n [Arguments Against]:
- Full pvt'n affected by BDC [?]
- No guarantee — catering services still receive complaints
- Creamy cap [cross subsidy?]
- Greater push for public transport — National devt [development]
- SO? Cost rational [?] / Regulatory Mech [Mechanism]
#Digital Era Quote
- "In the digital era, info & key [knowledge] is [illegible] & [illegible] is a weapon."
#Summary of Figures Cropped
| File | Page | Description |
|---|---|---|
| general_economy_p1_01.png | 1 | FCCF bar chart: 34% (2011) vs 28.8% (2018) |
| general_economy_p1_02.png | 1 | Liquidity Trap curve (Roi vs Demand for money) |
| general_economy_p2_01.png | 2 | Employment Matrix central diagram |
| general_economy_p2_02.png | 2 | 21st century fiscal architecture house diagram |
| general_economy_p2_03.png | 2 | PFMS/fiscal planning coordination diagram |
| general_economy_p3_01.png | 3 | MSME breakdown proportions (99/94/32/55%) |
| general_economy_p3_02.png | 3 | Share in world trade table (1991 vs 2017) |
| general_economy_p4_01.png | 4 | Low Tax-GDP ratio causes mind-map |
| general_economy_p4_02.png | 4 | Pre-GST vs Post-GST fiscal federalism diagram |
| general_economy_p6_01.png | 6 | 5F formula flow diagram (Farm→Fibre→Factory→Fashion→Foreign) |
| general_economy_p8_01.png | 8 | Ease of Living pie chart (SDG dimensions) |
| general_economy_p8_02.png | 8 | Export initiatives spider/web diagram |
| general_economy_p10_01.png | 10 | UDAY line graph (DISCOMs loan curve) |
| general_economy_p10_02.png | 10 | Logistics sector pie chart + transport mode bar |
| general_economy_p10_03.png | 10 | Energy Trilemma triangle |
| general_economy_p10_04.png | 10 | Investment Models table (BOT/EPC/HAM) + PPP Venn |
| general_economy_p10_05.png | 10 | Tourism area diagram |
| general_economy_p11_01.png | 11 | Micro-insurance 6 pillars of joy diagram |
| general_economy_p11_02.png | 11 | Cost vs Distance transport modes graph |
| general_economy_p11_03.png | 11 | Narasimham Committee 3-tier bank pyramid |
| general_economy_p11_04.png | 11 | IBC process flow diagram |
| general_economy_p11_05.png | 11 | IBC appeal hierarchy (NCLAT/SC/NCLT/DRAT/DRT/CoLLP) |
| general_economy_p11_06.png | 11 | Circular economy cycle diagram |
| general_economy_p12_01.png | 12 | GDR/ADR structure flow diagram |
| general_economy_p12_02.png | 12 | NARCL/IRDCL bad bank flow diagram |
| general_economy_p12_03.png | 12 | IBC process sub-flow (default→RP→CoC→plan) |
Indian Agriculture
Topper handwritten notes#Overview — Key Statistics (Page 1)
- 16.5% contribution to GVA [Gross Value Added]
- 42% contribution to employment
- 70% of rural HH [Household] depend on agriculture
- GCF [Gross Capital Formation] in agri = 15% (ES 19 [Economic Survey 2019])
#Agri Census 2015–16 (Page 1)
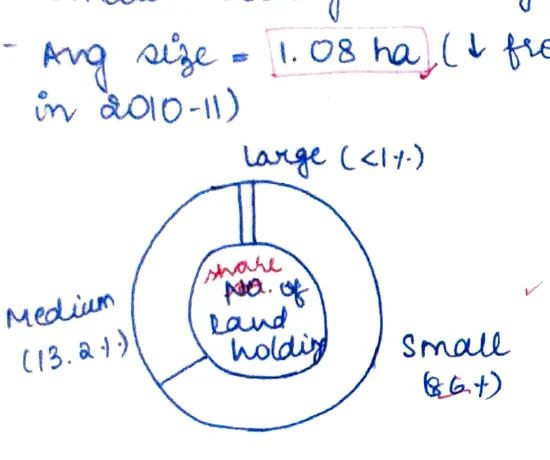
-
Concentric circle diagram showing distribution of land holdings by size category:
- Inner circle: Share / No. of Land Holdings
- Medium ring: Medium (13.2%)
- Outer ring: Large (<1%)
- Remaining segment: Small (86+%)
-
SHM [Small and Marginal] (<2 ha) = 85%
-
Small holdings increasing, large holdings decreasing
-
Avg size = 1.08 ha (↓ from 1.15 ha in 2010–11)
-
Female = ↑ from 13% to 14% in 2015–16
- SC = 12%
- ST = 8.5%
-
India = 10% of agri exports, 2% of world trade
-
Mango, Meat, Rice = ~58% of total exports
-
Agri export policy — ↑ from 30 bn USD to 60 bn USD by 2022
-
Food grain — ↑ from 51 mt [million tonnes] in 1950 to 295 mn (29.5 mn) in 2019 [illegible suffix]
#Irrigation (42%) (Page 1)
- Canal = 30%
- Tubewell = 60%
- Tanks = 5%
- ES 20 → [illegible] cycle
#Rainfed Agri (55%) (Page 1)
- 40% to agri GDP
- 60% of total rural workforce
- 60% of livestock in such areas
#Horticulture (Page 1)
- 16% of net sown area
- 314 mn metric tonne production [underlined]
- > food grain since 2012–13
- 33% to agri GDP [boxed: Ln → ? Exports]
#Livestock — DSBY [Doubling Farmers' Income / Dairy Sector] (A48) (Page 1)
- 20% to agri GDP
- 16% to small farm HH income
- 8/3rd of rural pop°
- 9% to per employment
- 8% growth rate
- Largest pop° in world
#Dairy (Page 1)
- NTI → 330 mn mt by 2023–24 [boxed: current]
- 65–70% of livestock = milk since last 20 yrs
- #2 in milk since last 20 yrs [boxed: out in 149 in Exports]
- CAGR = 16.5%
- 40% of GCF, cow urine°
- PC availability of milk = 394 gms
#Fisheries (Page 1)
- Mehru Khmer° [illegible] — Matsya Kisan° economy
- 2nd largest producer
- 7% to agri GDP
- CAGR = 7%
#Subsidies → Need SIA [Subsidy Impact Assessment] (Page 1)
- 1.2 L cr = 2.85% of GDP
- Fertilizer = 70k cr
- Credit = 20k cr
- 40% farm mech° (US 92%, China 60%)
#Allied Sector / Credit (Page 2)
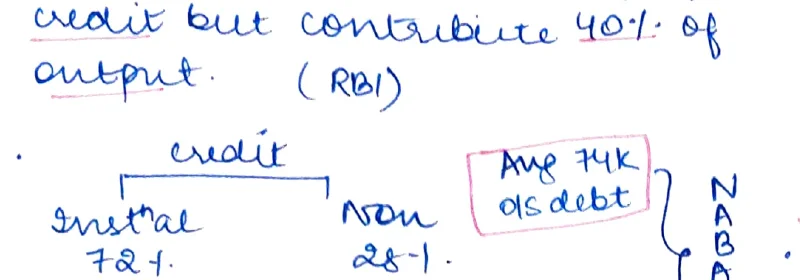
- Allied sector receives 10% of agri credit but contributes 40% of output (RBI)
- Credit breakdown:
- Institutional (Instl) = 72%
- Non-institutional = 28%
- Avg 74k as debt [boxed in red/pink]
- → NABARD [bracketed]
- 5Is = Irrigation, Investment, Infrastructure, Insurance, Intensification
- Handkerchief size land holding
- Evergreen Rev° [Revolution]
- Agri in ICU — Irregular, Cyclical, Uncertain Monsoon, Tech fatigue
- 53% of agri HH [Household] under debt
- 26% have insurance cover
- 82.5% of farmers are BPL [Below Poverty Line]
- Avg monthly income = ₹6246
#5Is Expanded
- Irrigation
- Investment
- Infrastructure
- Insurance
- Intensification
#Urea Dominates Fertilizer (Page 2)
- Most produced (86%)
- Most consumed (74%)
- Most imported (52%)
- Indiscriminate use
- Faulty govt policy
- No knowledge
- Organic manure↓
- Urea dominated
- Fiscal subsidies — 8nd [and] (after food°)
- Diversion of subsidy → urea = [illegible]
- Import reliance
#Diversion of Subsidy Table (Page 2)
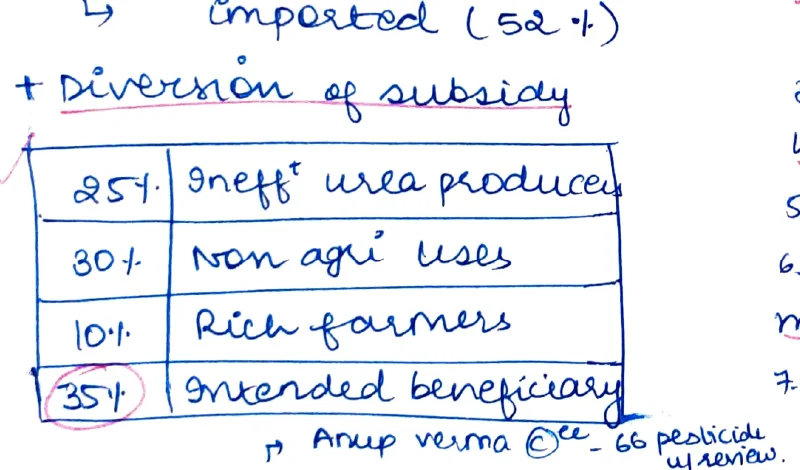
| % | Category |
|---|---|
| 25% | Ineff° [Inefficient] urea produced |
| 30% | Non agri uses |
| 10% | Rich farmers |
| 35% | Intended beneficiary [circled] |
- ↑ Anup Verma et°, 66 pesticide [illegible] review
#SO? [Solutions] — Deharaise Urea Imports
- NBS [Nutrient Based Subsidy], SHC [Soil Health Card], Neem coated
- DBTisation of subsidy
- Organic
- Policy & Regulation awareness
#Pesticides — 15–85% Losses due to Pest (Page 2)
- Water impact — eg Endosulfan poisoning in Kasaragod due to pest residue
- Aerial spraying on cashew plants
- Resistance — [illegible]
- Biopen? [illegible]
- No tech access — Drift nozzle, spray shields
- SO? Pesticide Mgmt Bill 2020
- IPM [Integrated Pest Management] [underlined]
- Awareness
- Organic Farm°
- MH → UP → Prime paddy → cotton
- Anup Verma E° — 66 [illegible] review
#Biopesticide
- = only 4.2% of total pesticide mkt [market]
- Only 12 are reg° [registered] under Insecticides Act, 1968
- 4th largest producer
- MH > UP > PB [Punjab], EHR [Himachal? illegible], paddy → cotton
- → PMB 2020
- Low NUE [Nutrient Use Efficiency] in agri = 38% despite consuming 80% of water resources [boxed in red]
#Farm Income & Productivity (Page 2)
- I took 22 yrs to 2x farm income at 3.3% growth rate during 1993–2015 (NITI)
- Pvt/Corp Invt = 2% only [underlined: Anup Daiwai?]
- 92k cr post harvest losses (NITI)
- Share of NE [North East] = <2% in agri credit → as per ES 20
- Annok Dalwai — only 15–40% share of farmer in consumer prices
#India map — NE agri credit share annotation
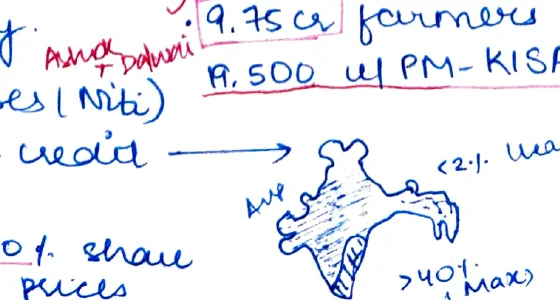
- Arrow: credit → India map (sketch)
- Annotation: NE = <2% (max)
- Annotation: >40% (max)
- 15–regional [illegible suffix] — 50 dist° of agri [illegible]
#Causes of Crisis in Agriculture (Page 3)
- Uneconomic / like hardholdings
- Stagnant prod° — falling yield & area
- Dual distress — [input cost ↑] [farm revenue ↓]
- Price risk
- Monsoon dependence
- Inadequate pub & pvt invt [investment]
- No access to formal credit
- CC [Climate Change]
- Overcrowded agri
- Faulty impl° of govt policies:
- Oppressive APMC [Agricultural Produce Market Committee]
- MSP [Minimum Support Price]
- Stock limits under ECA, etc.
#Consequences (Page 3)
- Low farm income
- Unsustainable livelihood
- NSSO — need at least 1 ha to cover consumption° but 65% have less than that → 213 farm HHs not able to make ends meet [boxed]
- Rising indebtedness
- Farmers' suicides — NCRB: 12,000 every year since 2013
- R-U migration [Rural to Urban]
- Exit from agri sector
- Rising dd [demand] for loan waivers
- CC's negative impact will be twice on unirrigated farm (20–25% income) than irrigated (15–18%)
#STO Farmers' Report (Page 3)
- By Centre for Study of Dev° Societies: point out that 76% of farmers would like to quit farming if given a chance
#Solutions — (Ashok Dalwai) (Page 3)
- Liberalise dep° of farmers
- Invt [Investment] — pvt — agri logistic, pub — irrig°, R&D, road
- Income diversity
- Extension services
- Agri mkt reforms
- Smarter credit
- Data
- Promote FoD Agri B [Freedom of Doing Agri Business?]
- Farmers as partners — approach FPOs [Farmer Producer Organisations]
- Revamp MSP regime
- Insurance
- Land reforms — NITI model law — Leasing
#Land Reforms Triangle Diagram (Page 3)
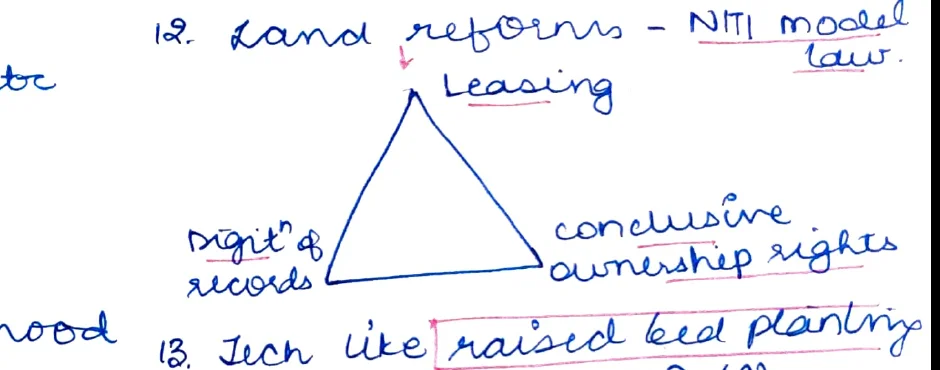
- Triangle with three nodes:
- Top → Leasing
- Bottom-left → Digit° [Digitisation] of records
- Bottom-right → Conclusive ownership rights
- Tech like raised bed planting — eg: soyabean in MP (↑)
- Invt subsidies s/t [subject to] water & power subsidies
- (6) Rootstock tech for fruits → can double prod° & is climate resilient
- Any sum insured p. ha [per hectare]
#Bar Chart — Avg Sum Insured per Ha (PMFBY) (Page 3)
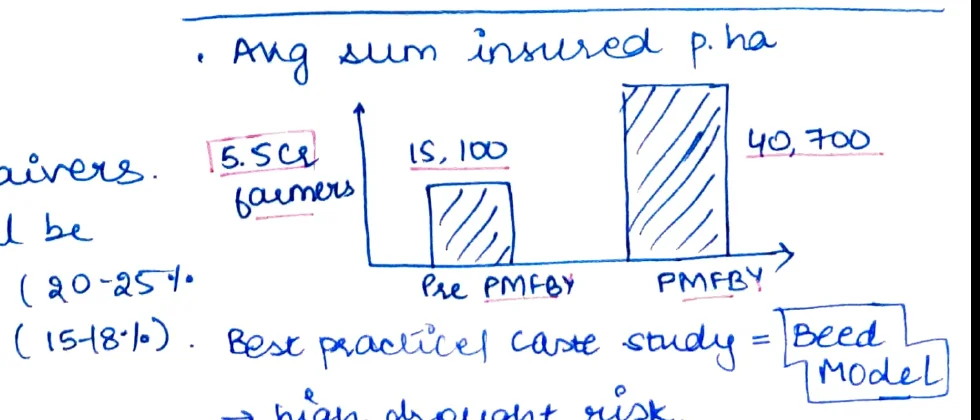
- 5.5 cr farmers
- Pre-PMFBY: ₹15,100 per ha
- PMFBY [Pradhan Mantri Fasal Bima Yojana]: ₹40,700 per ha
- Best practice / case study = Beed Model
- High drought risk
- Pvt co. reluctant
- Risk sharing by SG [State Govt] & AIC [Agriculture Insurance Company]
- If claims < 80% of gross premium: profits to be shared with SG
- If claims > 110%, state shared add'l burden
#Seeds (Page 4)
- Seed quality — MCI for 20–25% of crop prod°
- Low seed replace° ratio (no)
- Low quality
- Subsidised pvt (can on seed pricing) IPR [Intellectual Property Rights] issues
- Gaps in infra
- REID issues
#Solutions for Seeds
- ® [private sector]
- Seed village banks
- Infra
- Pvt sector
- Regulation
- 3P quality centre system
- Research?
- → Not Seed Exporter
#Fertilizers — 3% Subsidy Bill (Page 4)
- Indiscriminate use
- Faulty govt policy
- No knowledge
- Organic manure↓
- Urea dominated
- Fiscal subsidies — 8nd [and] (after food°)
- Diversion of subsidy → urea = [illegible 450?]
- Import reliance
#SO? (Page 4)
- Debarise urea imports
- NBS [Nutrient Based Subsidy], SHC, Neem coated
- DBTisation of subsidy
- Organic
- Policy & Regulation awareness
#Pesticides — 15–85% Losses due to Pest (Page 4)
- Water impact — eg Endosulfan poisoning in Kasaragod due to pest residue
- Aerial spraying on cashew plants
- Resistance
- Biopen? [illegible]
- No tech access — Drift nozzle, spray shields
- SO? Pesticide Mgmt Bill 2020
- IPM
- Awareness
- Organic farms?
- MH → US → prime → paddy → cotton
- Anup Verma E° — 66 [illegible] review
#Irrigation — 70% of Total Input Cost (Page 4)
- Water scarcity
- ↑ dd [demand] due to horti / pvt / meat
- Large area w/ rainfed
- Regional concentration
- Low WUE — uses 2–3 times more water vis-à-vis China
- Brazil
- → Net exporter of wtr [water] (Virtual Water)
#Problems
- Less usage of more eff° [efficient] micro irrig° system
- Depleting groundwater (269 apptt [districts] using agri)
#SO? [Solutions]
- Expand area (Har Khet Ko Pani)
- Focus on deprived regions (Budget 2019 → ₹2600 cr for 96 such dist.)
- Water harvesting & night [illegible]
- Tech + mntse [moisture] cropping pattern + SRI + water prot°
- Participatory IR. Mgmt & Water Use ₹300°
- AIBP [Accelerated Irrigation Benefit Programme]
- 4 NAT Water Mission
#Technology (Page 4)
- GM crops — Bt cotton & use of insecticide by 35% (↓ in AP [Andhra Pradesh]/guj [Gujarat])
- Precision farming
- GRI — s prod° by 30–35% — eg TN [Tamil Nadu], Bihar, Tripura
- GIS mapping
- Soil testing
- Resource conserv° tech like Zero tillage, Raised bed planting
- Hi tech horti — poly-houses & RTA [illegible]
#MSP (Minimum Support Price) (Page 5)
- Few crops (only 0.46% of [illegible]) most produced)
- Few regions — 35–40%: rice & wheat procured in PB [Punjab]/HR [Haryana]
- Fuelling inflation
- Rising MSP — ↑ in buffer supply → S market [Supply side], → mkt price ↑
- Open ended procurement
- ↑ prices of perishable is ↑ negligible
- Food subsidy bill
- ↓ to awareness (only SOI know about it) → corruption
- eg PM/ARSHA [illegible]
- PPSS [illegible]
- PDPS [Price Deficiency Payment System]
- PPSS — to lead to assured cropping pattern & nutritional security
#FCI (1964–65 MOCA) (Page 5)
-
MSP procurement
-
PDS [Public Distribution System]
-
Buffer stock
-
⊕ Max offered price at MSP
-
Open ended → 3x buffer stock
-
Off budget bouncings
- No auto liquid° [liquidation]
- On mkt/mg target [meeting target]
- Benefit inventory mgmt system
#PDS (Public Distribution System) (Page 5)
- Leakages & error [inclusion error = 25+%, exclusion = 61%] (as per CAG)
- FCI storage capacity
- Quality
- Lost items & nutritional size
- Int° challenges & WTO
- Mobility (ONORC) [One Nation One Ration Card]
- eg: TN — Uni PDS, Chhg [Chhattisgarh] — ePDS, MndPDS
- → UBI [Universal Basic Income], DBT [Direct Benefit Transfer], Food coupons (long trail)
#Shantakumar Ki [Committee] (Page 5)
- ↓ DBT to save 30k cr/year
- 4 beneficiaries = 40% ↑
- Raise supply = ↑ 1 kg/person
- Focus E & NE + oilseeds, pulses
- Food MIS [Management Information System]
- ↓ silos → CAP (×)
#Agri Marketing (Page 5)
- Mkt fragmentation°
- ↑↑ Unresisted move
- Discourage direct selling
- Exploit by intermediaries
- High incidence of mkt charges
- Pol corruption
- High wastage in SS chain
- ↑↑ infra in mkt
- High mktg cost
#Model APLM Act, 2017 (Page 5)
- ENPM
- EMRE
- [40–50% achieved off]
- off — PB [Punjab] Wheat Procurement Crisis 2016 ●
#Ashok Gulati (Page 5)
#Pricing Policy → Income Policy
- PDS
- Buffer stock
- ⊕ Max offered price at MSP
- Open ended → 3x buffer stock
- Off budget bouncings
#Food Processing (Page 5)
- 1.93 mn employed
- NITI say 40,000 cr worth food in India
- TN — own policy recently
- Only 8% fruits & veg — processed
- 1% meat
- 8% marine
- 75% of alcohol & energy°
- 90% of 1s cold storage store potatoes
- MOFI — 1988, 11th & 12th FYP
- 1001 FDI, AEZs
- ↑ on global food map
- "World's Food Factory"
#Constraints in Modernizing Agriculture — Flowchart (Page 6)
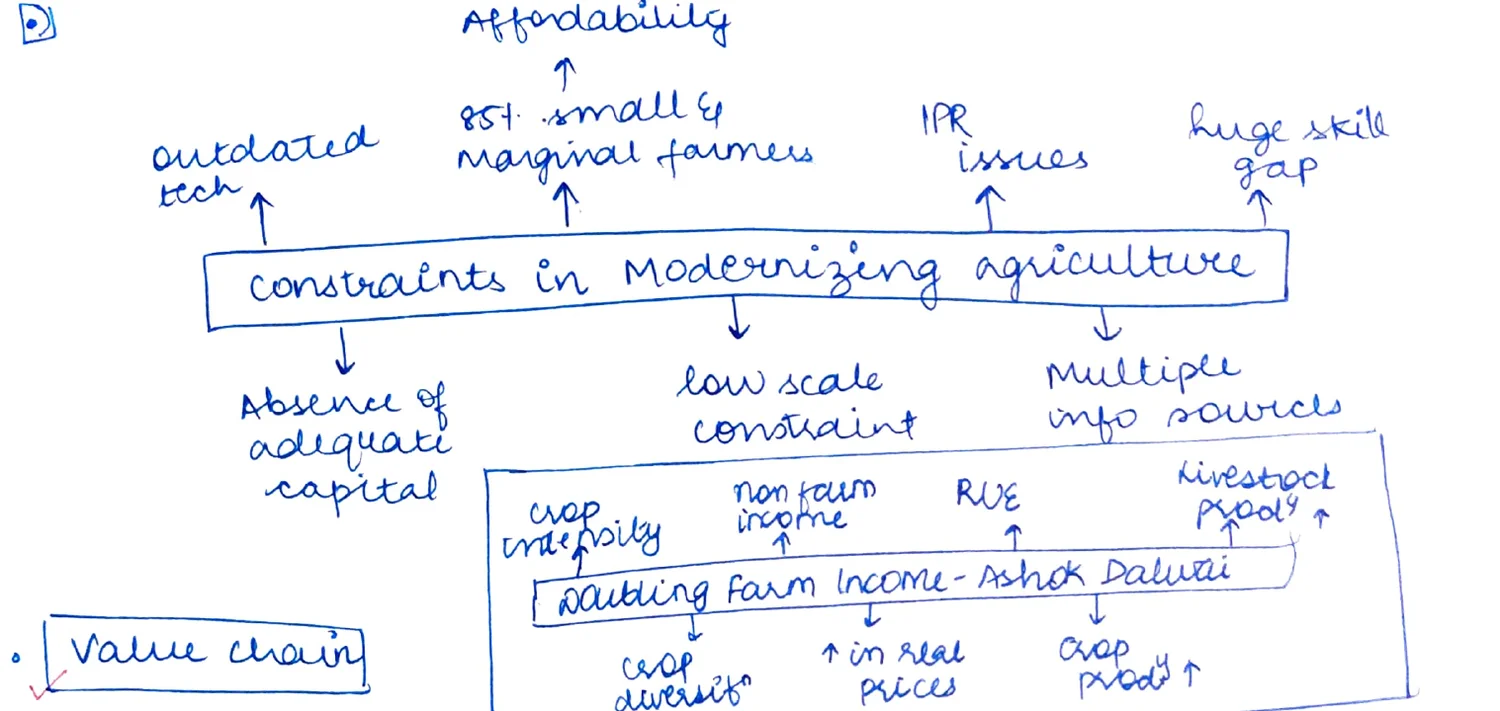
-
Constraints in Modernizing Agriculture [central box]:
- Affordability
- 85% small & marginal farmers
- IPP issues
- Huge skill gap
- Outdated tech
- Absence of adequate capital
- Low scale constraint
- Multiple info sources
- Affordability
-
Mattling Farm Income — Ashok Dalwai [inner table]:
- Crop onfisity [crop intensity]
- Non farm income
- Rise
- Livestock (prod°?)
- ↑ crop output?
- ↑ in real prices
- Ovt prod°?
#Value Chain (Page 6)
- Village level procurement
- Link production to processing
- Warehouse upgradation
#Agri Value Chain — Way Forward (Circular Diagram) (Page 6)
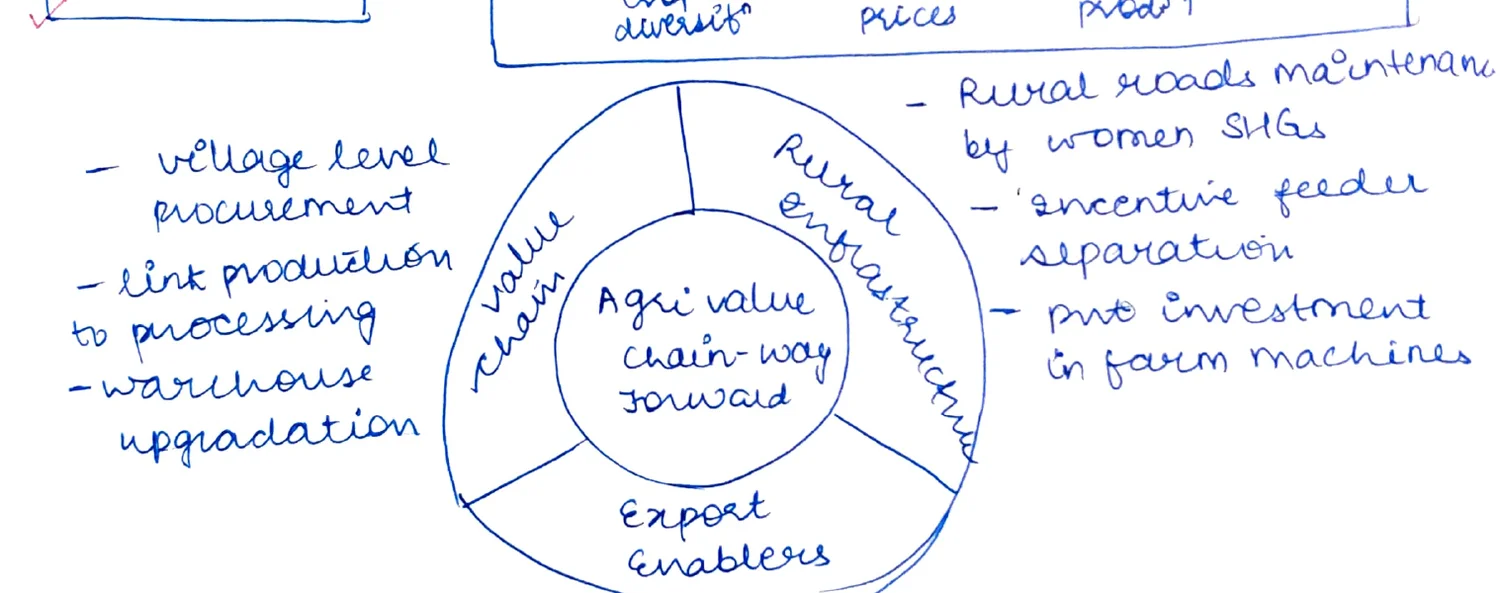
- Three-segment circle diagram:
- Value Chain (left segment)
- Rural Entrepreneurs (top-right segment)
- Export Enablers (bottom segment)
- Centre label: Agri value chain-way forward
- Rural roads maintained by women SHGs [Self Help Groups]
- Incentive feeder separation
- Pvt invt [investment] in farm machines
- Export oriented clusters
- ↑ no. of testing labs
- Regulation to ↓ rejection rate
#For DBT
- C + S + D + Block + GP [Gram Panchayat]
- Mdn DBT
- C → ₹ [illegible]
#Public Stocks Flow Diagram (Page 6)
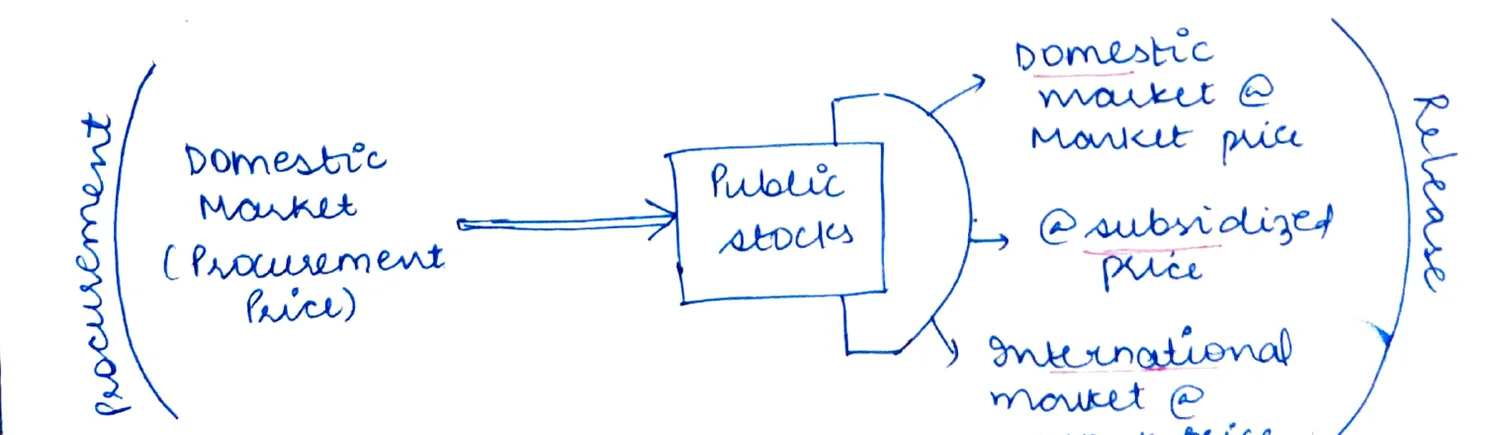
- Procurement ← Domestic Market (Procurement Price) → Public Stocks →
- Domestic Market @ Market Price
- @ Subsidised Price
- International Market @ Export Price
- → Release
- ⊕ Automatic liquidation of buffer stock on reaching target
#Micro-irrigation (Page 7)
- Drip / Sprinkler / Rain gun
#Advantages (+)
- WUE [Water Use Efficiency]
- Flexible
- Weeds / pests / fertilisers & energy eff°
- Cost saving
- New crop add°
- Add'al income (Integrate with solar)
#Disadvantages (−)
- High initial invt
- Used to few areas in MH [Maharashtra], AP [Andhra Pradesh], RJ [Rajasthan], KN [Karnataka], GUJ [Gujarat]
- (78% in 5 states)
- ↓↓ awareness
- Power subsidy discourages ↑
→ PMKSY [Pradhan Mantri Krishi Sinchayee Yojana]
#Conservation Agriculture — Circular Diagram (Page 7)
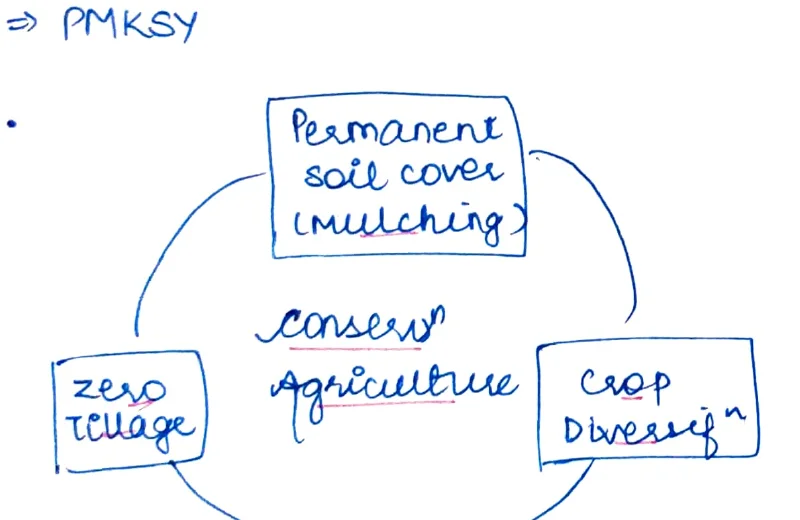
- Conservation Agriculture (centre label)
- Three components in cyclic diagram:
- Permanent Soil Cover (Mulching) [top box]
- Zero Tillage [bottom-left box]
- Crop Diversify° [bottom-right box]
#Dryland Agri (Page 7)
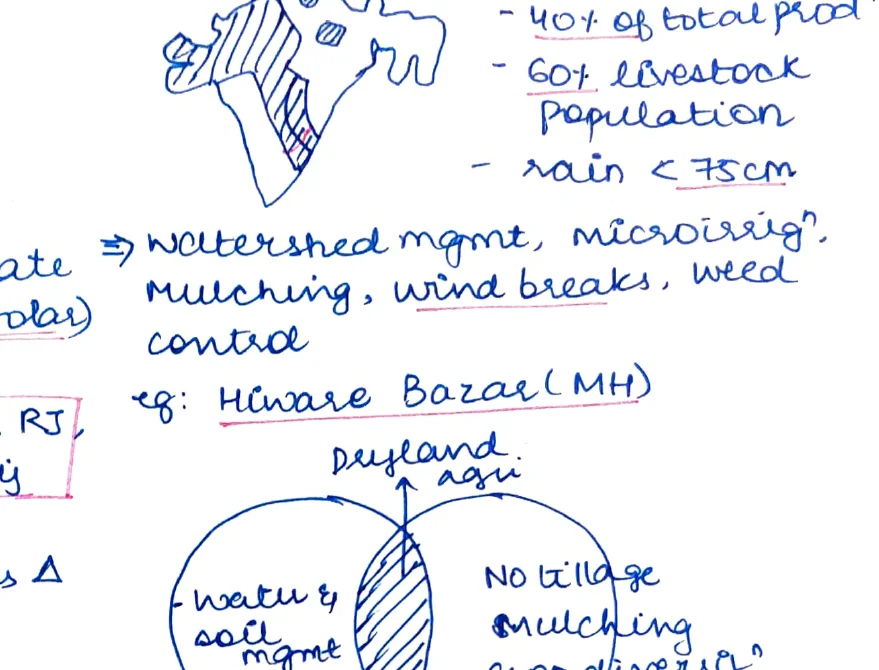
-
60% net cultivated area
-
40% of total prod°
-
60% livestock population
-
Rain < 75 cm
-
→ Watershed mgmt, Micro irrig°, Mulching, Wind breaks, Weed control
-
eg: Hiware Bazar (MH) [Maharashrta]
#Dryland Agri Venn / Circle Diagram
- Dryland agri (top label)
- Left segment: Water & soil mgmt
- Right segment: No tillage, Mulching, Crop diversity°
- Bottom label: Climate smart agri / Conserv° agri
#Doubling Farm Income (Page 7)
- Within agri:
- [sub-bullets illegible — lines indicated]
- Outside agri:
- [sub-bullets illegible — lines indicated]
#Agrarian Distress — India Map (Page 7)
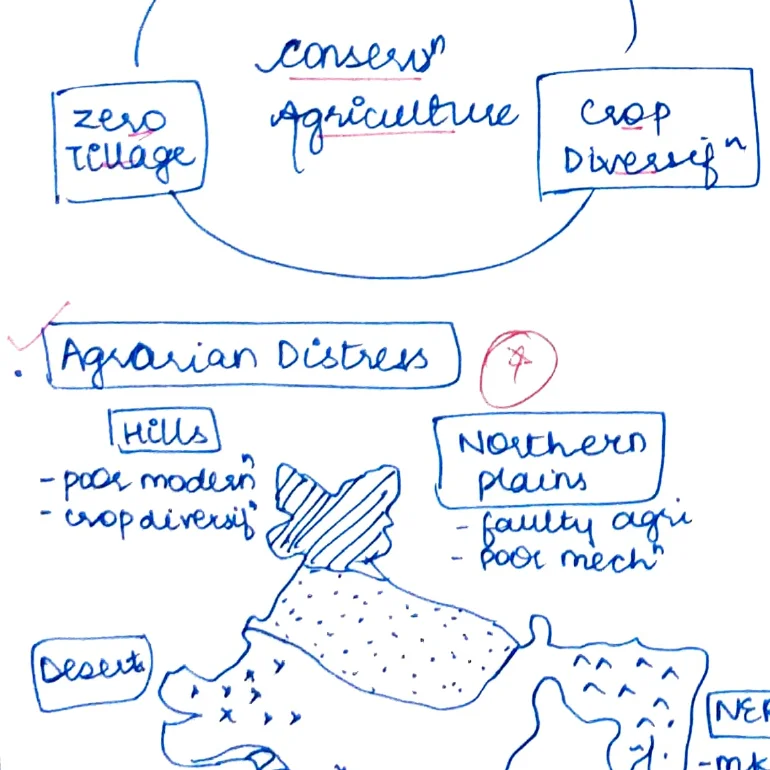
- Agrarian Distress ® [map of India with regional annotations]:
- Hills: Poor modern, Crop diversify°
- Northern Plains: Faulty agri, Poor mech°
- Deccan/Coastal [bottom half — drought prone]
- NER [North East Region]: Mkt access, Schemes benefits
- Desert: No mixed farming, Climate change, Poor RUE (land & water)
#Different Options for Different Regions — India Map (Page 7)
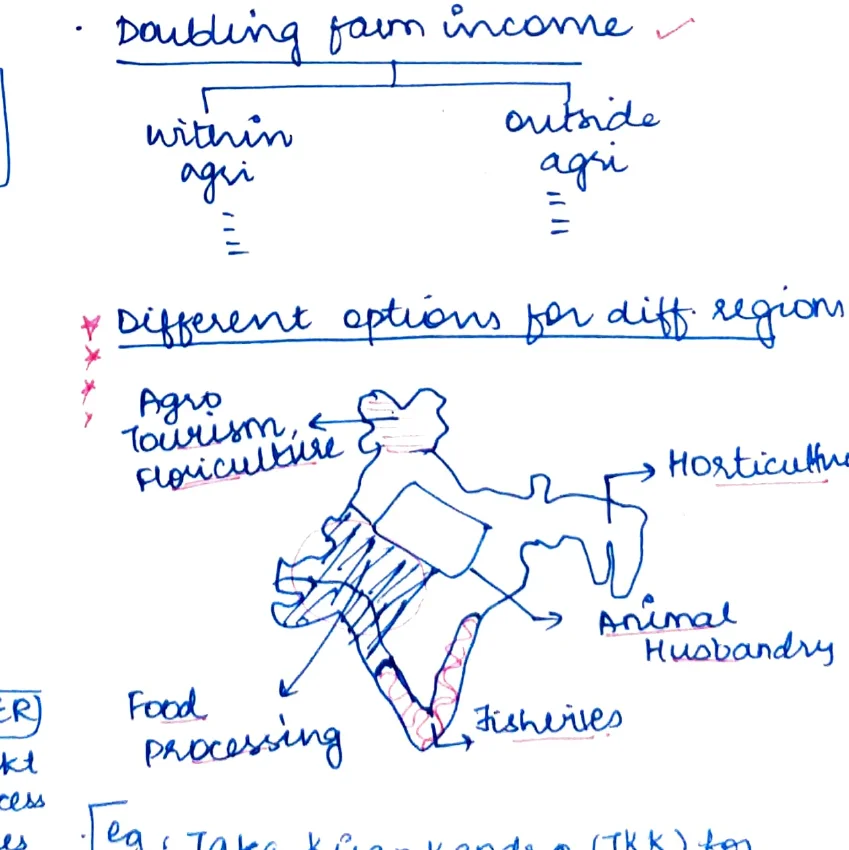
- Doubling Farm Income:
- Within agri [arrows down]
- Outside agri [arrows down]
- Different options for diff regions [India map with labels]:
- NE/North: Agro-Tourism, Floriculture
- East: Horticulture
- Central/West: Animal Husbandry
- Coast: Fisheries
- South: Food Processing
- eg: Taka Kisan Kendra (TKK) for precision farming in rural areas
#Pulses Production (Page 8)
#India Map — Pulses Prod° (Page 8)
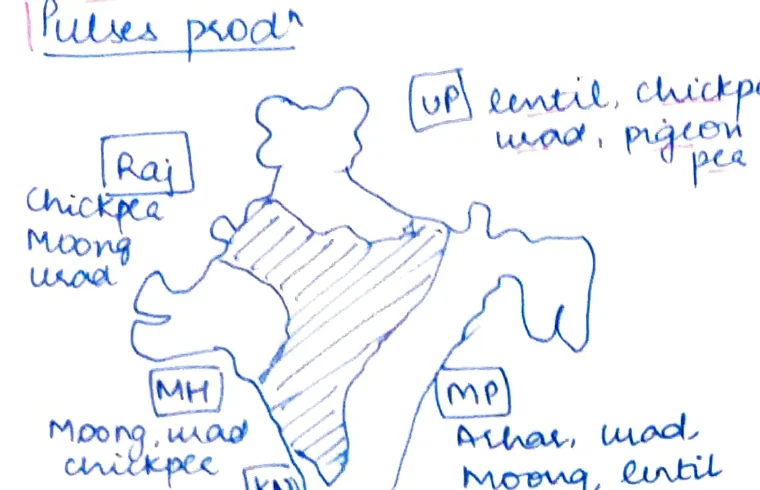
- Top states:
- RJ [Rajasthan]: Chickpea, Moong, Urad
- UP: Lentil, Chickpea, Urad, Pigeon Pea
- MH [Maharashtra]: Moong, Urad, Chickpea
- MP [Madhya Pradesh]: Arhar, Urad, Moong, Lentil
- KN [Karnataka]: Pigeon Pea, Chickpea, Urad
#Top States in Pulses Prod°
- Largest producer = 25% — } FAO
- Consumer = 27% — } 112 mn [mn tonnes?]
- Importer = 14%
#Bar Charts — ↑ in Pulses Prod° & ↑ in Rice Prod° (Page 8)
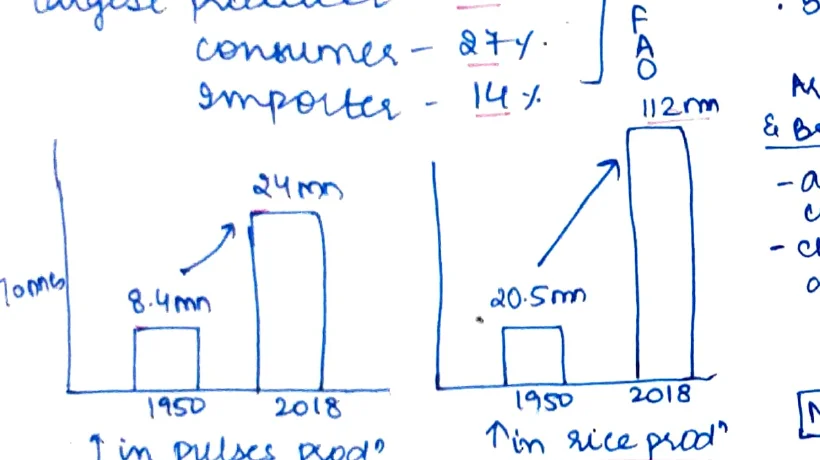
| Crop | 1950 | 2018 |
|---|---|---|
| Pulses | 8.4 mn [tonnes] | 24 mn |
| Rice | 20.5 mn | 112 mn |
#In India, Livestock Wealth is More Equitably Distributed than Land (Page 8)
- 70% of livelihood → 67% of small market & marginal farms
- Its growth has more potential to ↓ poverty, ↓ inequality, being inclusive growth
#Oilseeds (Page 8)
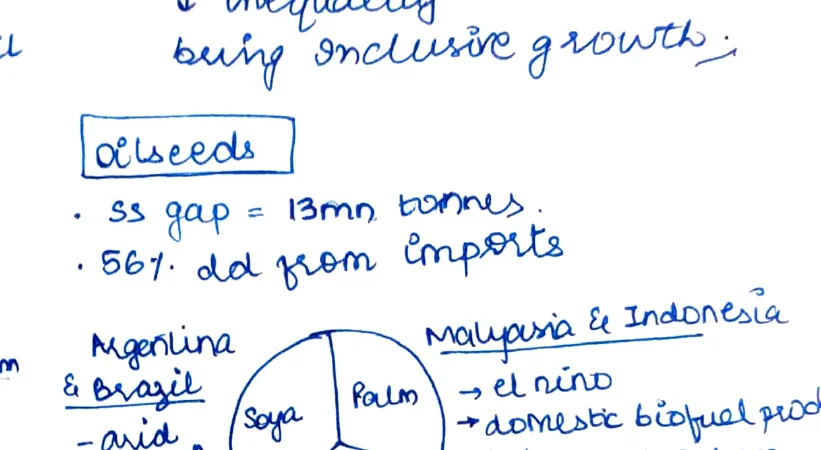
- SS [Supply-Side] gap = 13 mn tonnes
- 56% dd [demand] from imports
#Major Imports:
- Argentina & Brazil: Soya — arid conditions, climate change, dams?
- Malaysia & Indonesia: Palm — El Nino, → domestic biofuel prod°, → labour shortage
- Russia & Ukraine: Sunflower (dry cond°)
#NMOE-OP [National Mission on Oilseeds & Oil Palm] (+) (Page 8)
- → CSS [Centrally Sponsored Scheme] (80:20)
- → Focus on NE & AmN [Andaman & Nicobar] (geog factors)
- → VDF
- → 884% cr budget by Centre
- → Aim = 6.5 L ha by 2025 & OP = 11.26 tonnes
- Focus
#For Farmers | Inputs
- Price assurance | Planting material
- VGF [Viability Gap Funding] | Seed garden
- Sumine? [illegible] | ₹48,280/plant for restoration [SMVM 2037?]
#For Industries
- ↓ 5cr for 5mt/ha unit
#Additional (Page 8)
- 2080–21 → 1251 tonnes of oilseed oil
- Imported, 56% → Oil palm
- → 8.9 L ha potential for OP (ICAR)
- → Requires less water
#SO?
- MSP
- CC [Climate Change]
- HYV [High Yielding Varieties]
- Salinity
- Poor drainage — VRD mt. Bengal
- GR 2.0, PM ARSHA, 2x income
#Farm Problems Flowchart (Page 9)
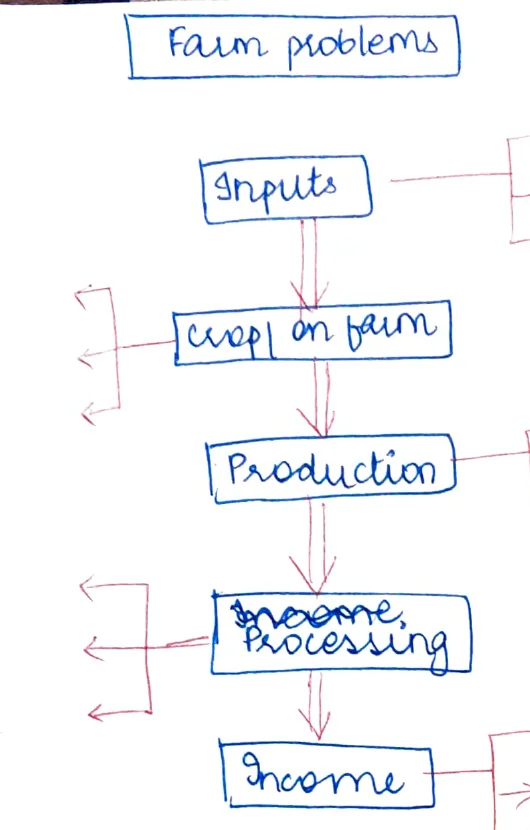
- Farm Problems [header box]
- Flow (top to bottom, blue boxes, red feedback arrows):
- Inputs
- Crop on Farm
- Production
- Income / Processing
- Income
- Red arrows pointing left/back at each stage = problem/leakage points
#Mega Food Park — Flowchart (Page 9)
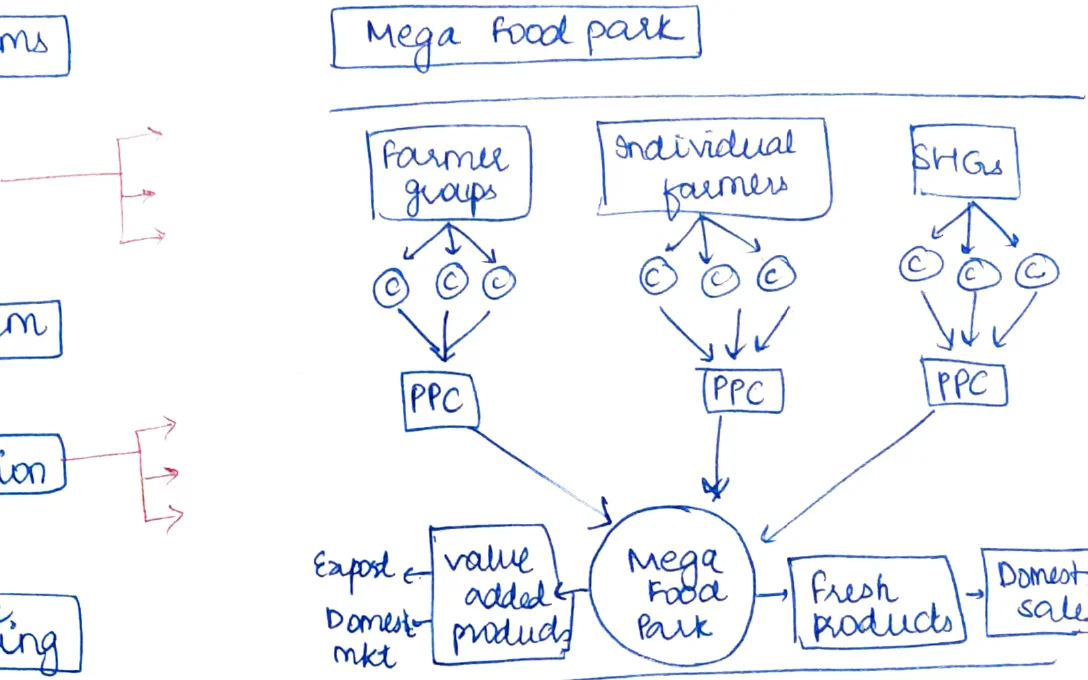
- Mega Food Park [header box]
- Three upstream input types:
- Farmer Groups → (C) [collection centres] → PPC [Primary Processing Centre]
- Individual Farmers → (C)(C)(C) → PPC
- SHGs [Self Help Groups] → (C)(C)(C) → PPC
- All three PPCs → Mega Food Park (central circle)
- Outputs:
- → Value Added Products → Export / Domestic mkt
- → Fresh Products → Domestic Sale
- © = Collection centres
- PPC = Primary Processing Centres
- "Future belongs to nations with grains, not guns — MS Swaminathan"
#Land Leasing (Page 9)
- Farmer A — Lease agri land — written contract → Farmer B
- → Rent on land
- → No forced eviction
- → Take bank loans & shut [initiate?]
- → Migrate to more gainful empl°
#Benefits to Economy
- Consol° of land
- Disguised unempl° ↓
- Agri prod° ↑
- Occupational mobility
- Swasthi Dhara, Khet Hara [scheme name?]
#ZBNF — Zero Budget Natural Farming (Page 9)
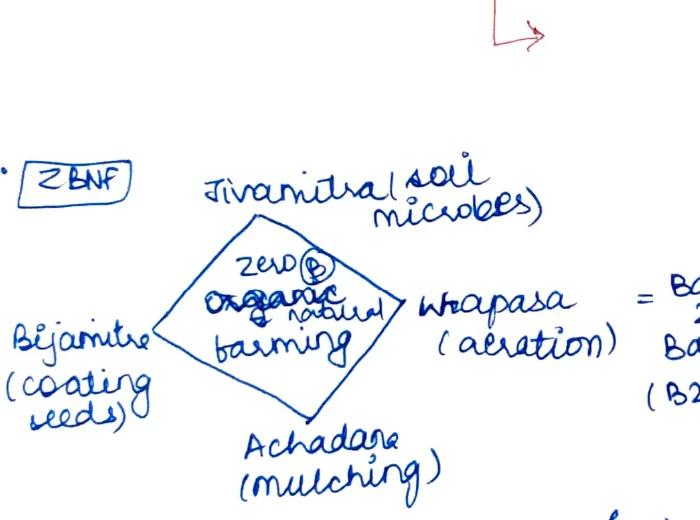
- ZBNF [Zero Budget Natural Farming] — diamond diagram:
- Top: Jivamruta (soil microbes)
- Left: Bijamitra (coating seeds) [Bijamitre]
- Bottom: Achadare (Mulching)
- Right: Whapasa (aeration)
- Centre: Zero ® Organic / Natural Farming
- = B2B [Business to Business] — Basa? [illegible]
- "A tech for future with trad° wisdom"
#PMFBY — Pradhan Mantri Fasal Bima Yojana (Page 9)
- CNG — 37% didn't know about scheme
- 50% dist = 50% claims
- 4 pvt co. recently opted out due to low profitability (CC ↑)
- [SHC] → 22.5 cr cards distrib°
- Fertiliser = ↓ by 10%
- Yield = ↑ by 6%
- Testing capacity (pa) = ↑3.5 cr [illegible suffix]
- 36% of 1s farmers are landless
#Mehlink Jafri, AIR 17 [Signature / Topper Credit] (Page 9)
#Examples (EP) — Best Practice Cases
- Rice fish culture — Kerala
- Pani Bachao, Paisa Kamao — PB [Punjab]
- IPM [Integrated Pest Management] against pink bollworm — Matsya Mitra, Jharkhand
- Strawberry cultivation — Meghalaya
- Yantradoot village — CHC [Custom Hiring Centre] in model villages in MP
- Mission Kakatiya — TL [Telangana], Bhungoo, Gujarat
- Pani Panchayat — Odisha [Rainwater Mgmt]
- Hiware Bazar — MH — Watershed Mgmt [underlined]
- [illegible]
- Artificial glaciers — Ladakh
- NITI — yield gaps due to:
- Gap b/w best scientific practices & best field practices
- Gap b/w best field practices & avg farmer
- ARYA, Integrated Farm Mgmt
- 9.75 cr farmers to get over ₹500 u/ PM-KISAN [Pradhan Mantri Kisan Samman Nidhi]
Science & Technology
Topper handwritten notes#Artificial Intelligence (AI)
- Definition / framing: when a computer mimics human [intelligence]
- AI → 5I characteristics:
- Inclusiveness
- Indian
- Innovation
- Smt [Smart]
- Int'l coop [International cooperation]
- (by PM Modi)
- #9 in AI specialisms [India's global ranking]
- CBSE: AI as an elective subject in IX [Class 9]
- IIT-H [IIT Hyderabad]: full-fledged B.Tech in AI
- Industry–academia eg IBM's Blue Planet Project
- eg: Sun, key driven cars
- Fn: friend suggestions, pop-ups, Alexa, kanalloot [Kana lloot]
#AI Sense–Comprehend–Act Framework
- Sense → input perception
- Comprehend → understanding
- Act → action/decision
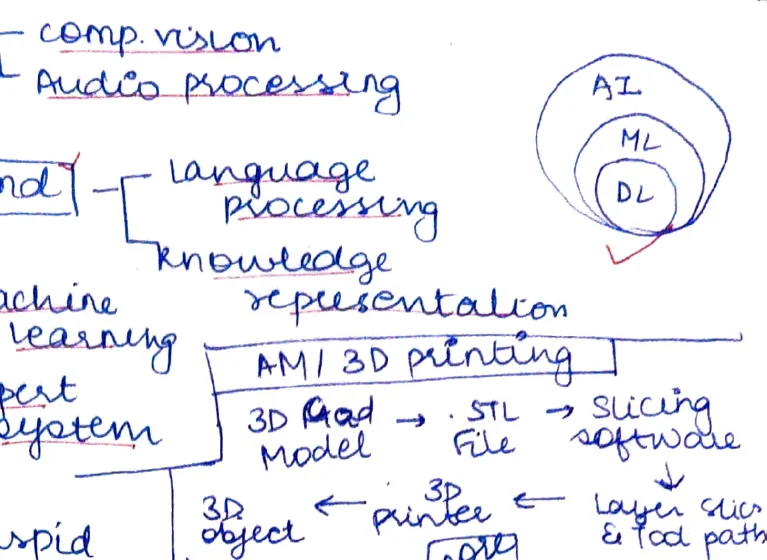
- Machine Learning [ML]
- Expert Systems [ES]
- AI / ML / DL [Deep Learning] — nested circles (AI outermost, DL innermost)
#Best Practices / Applications of AI
- Alexa lectures in rural areas
- Odisha: SATARK – DM [Disaster Management] assistance
- Amazon: Inventory management
- Odisha: Digi Dispensary
- Google: DeepMind
- Telemedicine: IBM Watson
- SUFACE [SUFACE platform]: Judiciary
#AI Policy / Governance
- NITI Aayog: National Programme on AI
- AIRAWAT [AI Research Analytics and Knowledge Assimilation Platform] / cloud computing
- OECD Principles on AI
- Gyaan Dhaam [Knowledge hub]:
- Knowledge representation
- Analytics to real discovery
- Chai Dhaam: Roadmap for Tech in India
- Kaushalya Dhaam [Skills hub]: Nurture human capability, upskilling of youth
- Samvad Nigadhaam [Dialogue hub]:
- Five transition
- Based on social equity
- Inclusive
- "Rise of full AI could spell the end of human race" — S. Hawking
#5G
- 800 towers connected by machine on optical fibre
- AI facilitated service
- 3V: volume of big data depends on 5G
- Volume, Velocity, Variety
- 1 billion digital economy
- 5G hackathons
- Do Now [DoNo – Telecom initiative]
- Collab with Ericsson, Nokia
#4G vs 5G Comparison
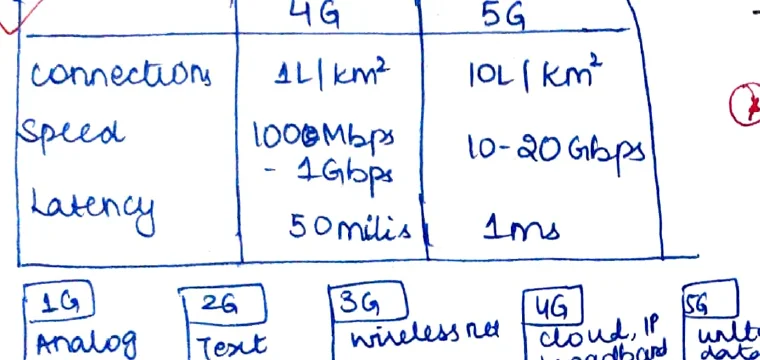
| Parameter | 4G | 5G |
|---|---|---|
| Connection | 4L/km² [400,000 per km²] | 10L/km² [1,000,000 per km²] |
| Speed | 1000 Mbps – 1 Gbps | 10–20 Gbps |
| Latency | 50 ms | 1 ms |
#Mobile Generations Timeline
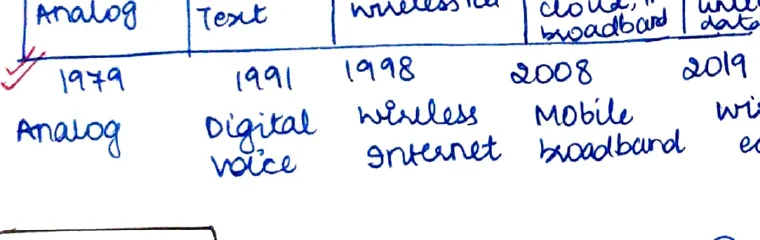
| Generation | Year | Key Feature |
|---|---|---|
| 1G | 1979 | Analog — voice only → calls |
| 2G | 1991 | Digital — text; Voice + Data: GPRS, SMS, Email |
| 3G | 1998 | Wireless net — Digital voice, Data–HSPA; V-call [video call] |
| 4G | 2008 | Cloud, IP, broadband — Voice + Data–LTE; HD videos |
| 5G | 2021 | Ultr [Ultra] — [sub-ms latency, massive IoT] |
#Quantum Technology
- Google Sycamore [quantum processor]
- DST: QUEST [Quantum Enabled Science and Technology programme]
- NM-QTA [National Mission on Quantum Technologies & Applications] @ Budget 2020 → ₹8000 Cr, 5 years
- Quantum Key Distribution [QKD] tech – DRDO
- Micius satellite of China
- None in India
- MST's NSM-70 [National Supercomputing Mission] — supreme comp [supercomputing]
#Darknet
- "Underworld of the Internet"
- eg: TOR [The Onion Router] during Arab Spring
- eg: Zomato ethical hacking
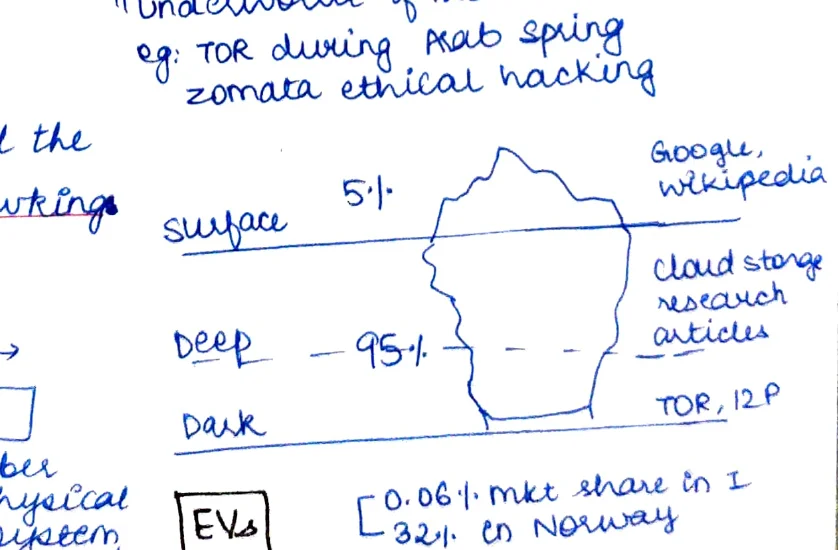
- Surface web — 5% [~5%]: Google, Wikipedia
- Deep web — ~95%: Cloud storage, research articles
- Dark web — [subset of deep]: TOR, I2P
- Description: "underworld of the internet"
#Industrial Revolution 4.0 (IR 4.0)
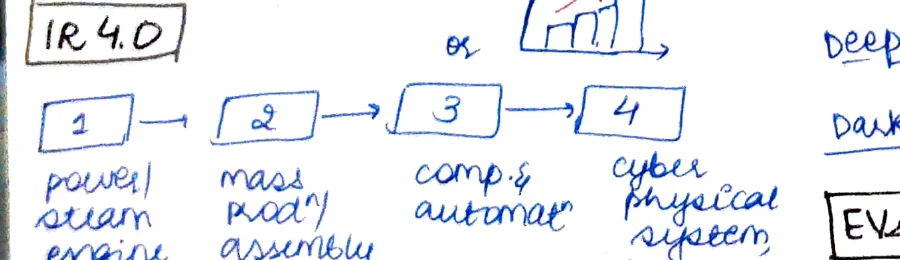
- IR 4.0 = or [alternative framing as] a bar chart of rising productivity
- Stage 1 → Power/Steam engine
- Stage 2 → Mass production/assembly
- Stage 3 → Computers & automation
- Stage 4 → Cyber-physical systems / AI / Robotics
- South Korean city of Sangdi uses IoT to handle traffic problem, save water, energy & maintain environment
- Centre for IR 4.0 (WEF) — 4th in world [India hosts one]
#Electric Vehicles (EV)
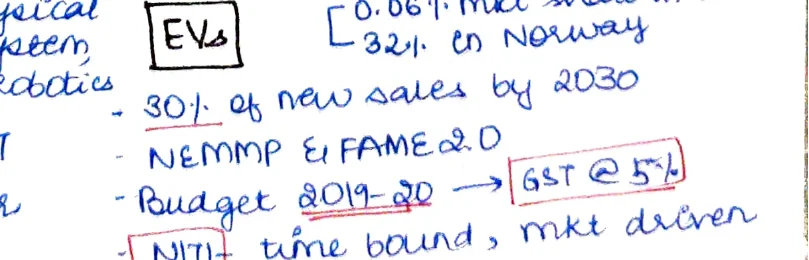
- 0.06% market share in India
- 32% in Norway
- 30% of new sales by 2030 [India's target]
- NEMMP [National Electric Mobility Mission Plan] & FAME 2.0
- Budget 2019–20 → GST @ 5%
- NITI [Aayog]: time-bound, market-driven approach
- Upstream [approach]: Tier 2 / Tier 3 cities & urban parts
- Power triangle → "Nanopower" [emerging term]
#5G (page 2 additional)
- Nanospaceship [nano-scale satellite concept]
- C of E [Centre of Excellence]: IIT B, IISc
- BRI [Bilateral Initiative]: ₹3000 pappu in nanoscience
- Nanomission, 2007
#Nanotechnology
"Plenty of room at the bottom" — Richard Feynman
- Scale: 1–200 nm
- Approach:
- Bottom Up [assembly from atoms]
- Top Down [miniaturization from bulk]
- 30 mg [scale of nanoparticle quantities]
- Applications:
- Nano robots for root canal (#54 [importance rank])
- Nano catheters for eye surgery
- Nano sponges (toxin from blood)
- Nanopores for eff [efficient] DNA sequencing
- Silver np [nanoparticles] = anti-properties
- Nutraceutical — nutrient delivery
- Nano urea by IFFCO
- Gold np → nano-medicines
- Zinc oxide np → sunscreens
- Nano chips = 1 to 10 pu [transistors] per inch — nanosized
- Nano solar cells — graphene
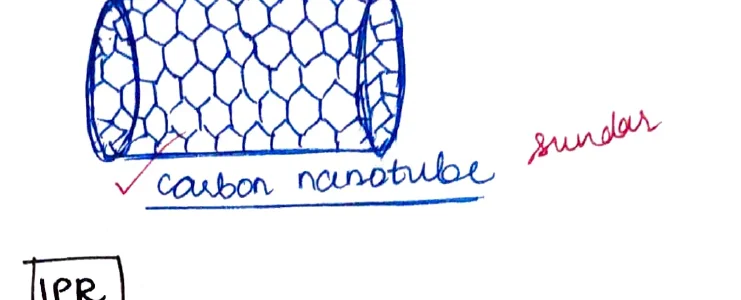
- Carbon [nano]tubes — miracle building blocks
- Non-filter [water] purification
- Compulsory licensing eg: Nexavir [Nexavar — Novartis/Bayer drug]
- Biopiracy eg Monsanto & Melon
- Piracy — DU Photocopy case
- Evergreening — Sec 3d — Novartis case
- Patent prosecution highway with Japan
#Carbon Nanotube Diagram
- Hollow cylindrical tube of carbon atoms in hexagonal lattice
- Labelled: "carbon nanotube — Sundar [Pichai connection/reference]"
#Intellectual Property Rights (IPR)
- Art 27 of UDHR [Universal Declaration of Human Rights]
- Nat'l IPR Policy, 2016 – "Creative India, Innovative India"
- L2Pro [Law to protect] — relaxed about IPR
- Scheme (IPR Scheme): [CIPAM – Cell for IPR Promotion and Management]
- GII Rank [Global Innovation Index]:

- 2015: [~81st rank] | 2021: [46th rank] — rising bar (visual shown)
- Patent density comparisons:
- US → 1 patent for every 6,000 people
- China → every 25,000 people
- India → 1 for 600,000 people
- → 600 times bigger opportunity [India's potential]
#IPR Issues
- Compulsory licensing eg: Nexavar, Melon
- Biopiracy eg Monsanto
- Piracy — DU Photocopy case
- Evergreening — Sec 3d — Novartis case
- Patent prosecution highway with Japan
- Pepsico & Guj [Gujarat] farmers [potato variety IP case]
#Patent Pool
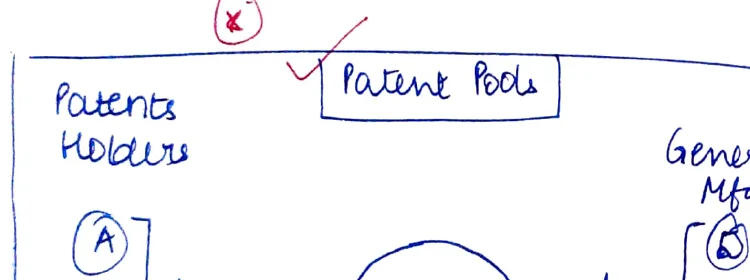
- Holders (A, B, C circles) ←→ Licensees (D, E, F circles)
- A → Licenses → D
- B → Sub-license → E
- C → Royalties ← fees ← F
- Intersection = Patent Pool
- eg: Medicine Patent Pool framed in [Geneva] for cheap drugs for HIV/TB/Hep C
#Biotech
- Four colours:
- Red (Medical)
- Green [agriculture]
- Blue [marine]
- White [Industrial]
- 3% share in global BT [Biotech] industry
- Nat'l BT Dev't Strategy 2015–20
- Top #2 biotech destination in Asia; #12 in world
- DBT [Dept of Biotechnology] WIMST in 1986
- ₹30 bn [India's biotech industry]
- 4th largest → [will be] 2nd in biotech → expected to grow to $150 bn by 2025
#Blockchain Technology
"Decentralized, distributed ledger that records transactions across computer networks"
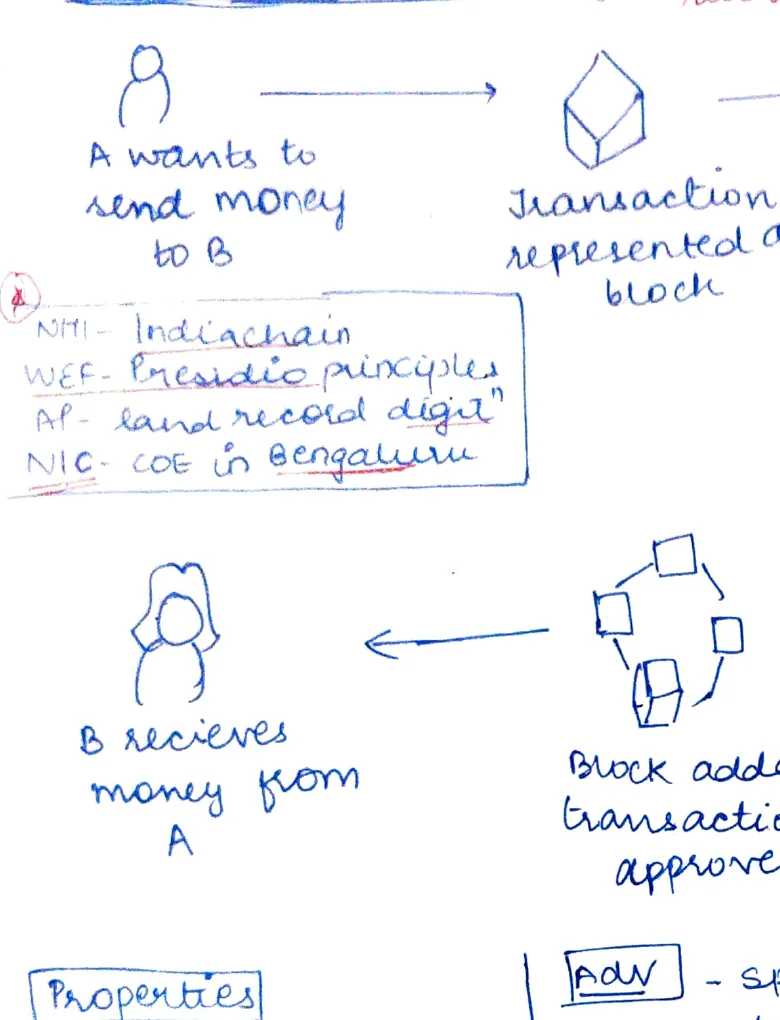
- Step 1: A wants to send money to B → Transaction represented as a block
- Step 2: Block broadcast on network (shown in network diagram)
- Step 3: Block added, transaction approved, verified by all
- Step 4: B receives money from A
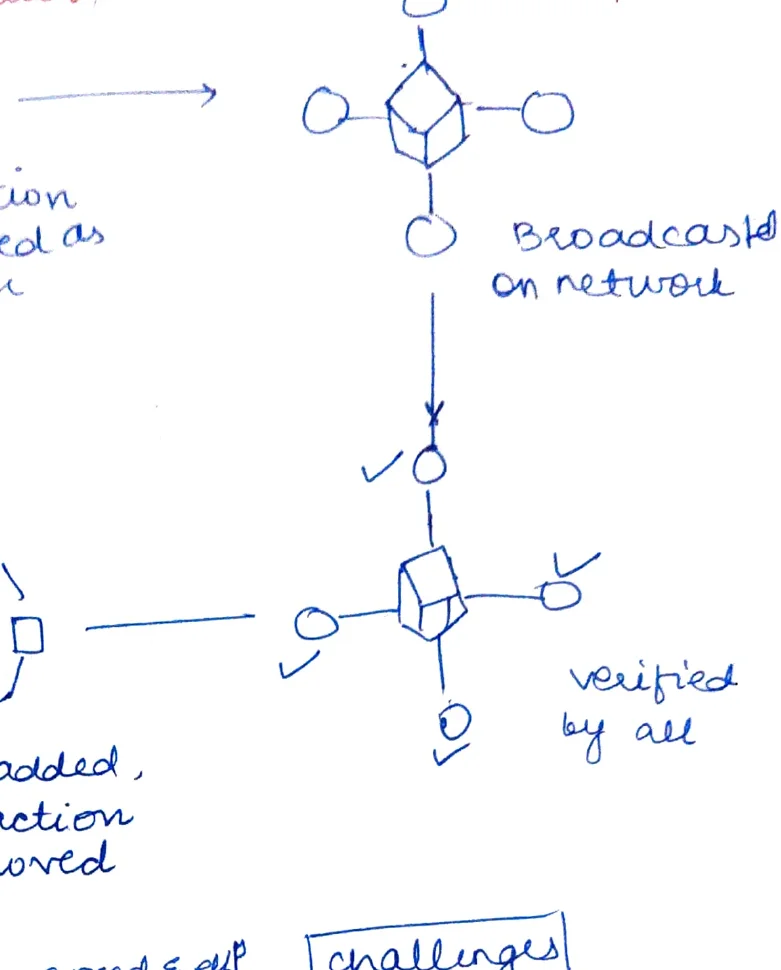
- Block → broadcast on network → verified by all nodes → added to chain
#Properties of Blockchain
- Anonymity
- Crypto-based security
- Immutability
- MCT [Multi-party Consensus Technology]
- Distributed ownership
- Decentralised network [N/w]
#Advantages of Blockchain
- Value addition
- Governance
- No middlemen = Transaction cost ↓
- Protection from fraud(s)
- Business process improvement
- 10% GDP stored in blockchain [WEF estimate]
- Transparency
#Applications
- APPs — Land records, certificates, Health ID, pension distribution, subsidy, bank ledgers, microfinance/mgmt
- NF → WEF → Presidio Principles on Blockchain / Bill of Rights
#Challenges
- Speed & efficiency
- Additivity [scalability issues] in finance
- Middleman dilemma
- Transaction cost ↓ [can be double-edged]
- Data localisation / traceability
- Less value [GP will be] in BC by 25% [adoption lag] — WEF
- Transparency (↓ privacy concern)
- Scalability
- Tech
- Privacy
- Data localisation
- Skills
- Cybersecurity
- Parallel economy
#Deep Sea Mission
- ISA Permission [International Seabed Authority]
- ₹8000 Cr / ~15,000 km² central [OR] exploration
- Cost (→) of scaling [roughly]:
- PPM [Parts Per Million]
- Research on CC [Climate Change] & gulf [gulf streams]
- DM [Disaster Management]: Tsunami, PD
- Med [Medicine]: drugs / ocean resources
- CNT [Carbon Nanotube extraction]
- Manned submersible: 6000 m depth
- Powered by solar energy
- Submersible vehicle: 6000 m depth
- ₹4000 Cr [budget]
- Collab: ISRO / DST / MoES [Ministry of Earth Sciences] / DRDO / ICAR etc.
- Samudrayaan Mission
- NF → WEF → Presidio Principles / the Bill of Rights [mentioned alongside blockchain]
- Health ID, pension distribution [blockchain application]
#Artificial Intelligence (detailed — page 4)
#AI Components Tree (Sense–Comprehend–Act)
- Sense: Input — sight, sound
- Comprehend:
- Language processing
- Knowledge representation
- Act:
- Machine Learning [ML]
- Expert Systems [ES]
- AI / ML / DL — concentric circles [AI > ML > DL]
- Comp vision [Computer Vision]
- Audio processing
#3D Printing [Additive Manufacturing — AMI]
- 3D CAD → STL [Stereo Lithography file] → Slicing → separate layers
- 3D object → printer → part(s) → lay-in-space to form tool path
- AMI [Additive Manufacturing India]
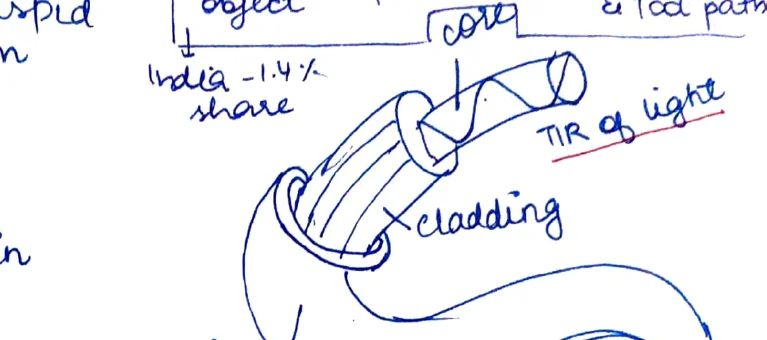
#Optical Fibre
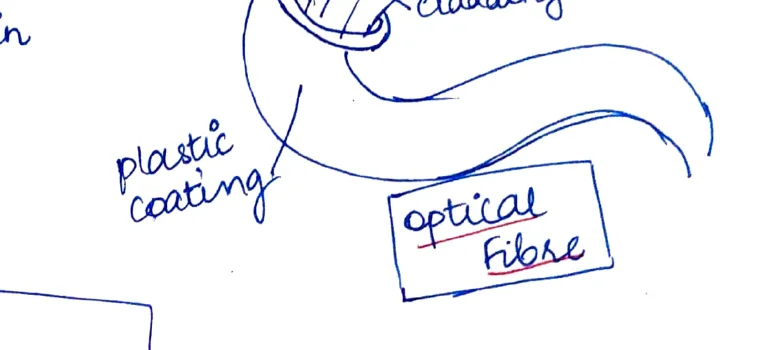
- Core → index ↓ [lower refractive index cladding surrounds]
- Cladding — [higher refractive index core]
- Plastic coating [outer jacket]
- Total internal reflection → ray of light propagates
- Optical fibre = transmission of light (not electricity)
#SARS-CoV-2 Structure
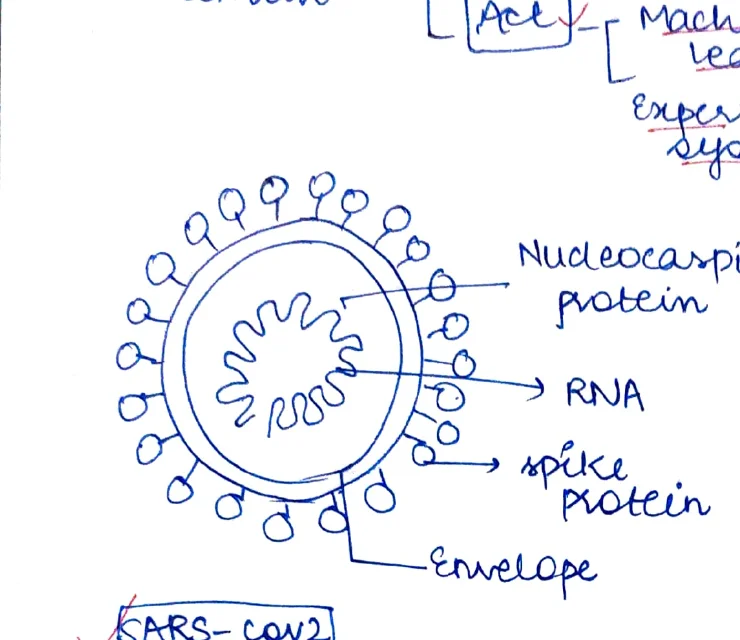
- Nucleocapsid protein — surrounds genetic material
- RNA — genetic material (single-stranded)
- Spike protein — outer projections (binds ACE2 receptors)
- Envelope — lipid bilayer outer shell
- SARS-CoV-2 labelled with tick [important]
- Patents → Patent Pools [for vaccine/drug access]
#Space Technology (page 4 & 5)
#ISRO Timeline
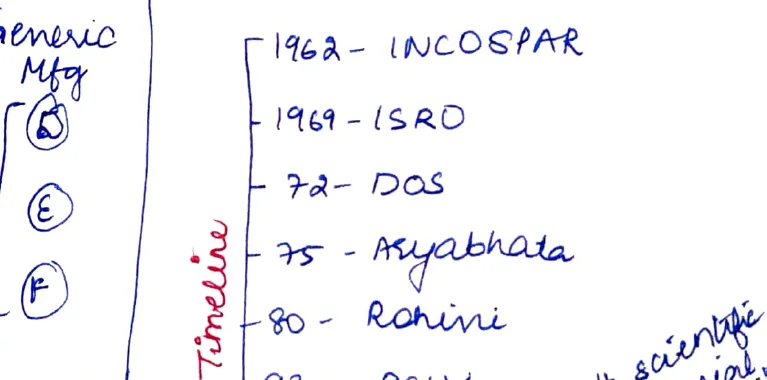
- 1962 — INCOSPAR [Indian National Committee for Space Research]
- 1969 — ISRO [Indian Space Research Organisation]
- 1972 — DOS [Department of Space]
- 1975 — Aryabhata [first Indian satellite]
- 1980 — Rohini [first indigenously launched satellite]
- 1993 — PSLV [Polar Satellite Launch Vehicle]
- 2013 — GSLV [Geosynchronous Satellite Launch Vehicle]
#Science & Social Responsibility
- # Scientific social responsibility [note on margins]
#Space Org Structure
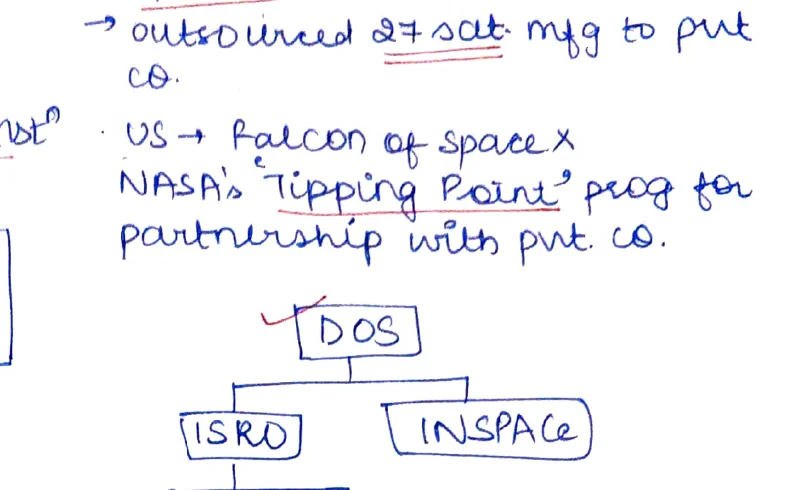
- DOS [Dept of Space]
- → ISRO [Indian Space Research Organisation]
- → Antrix [commercial arm]
-
- → NSIL [NewSpace India Ltd] (dashed = new)
- → INSPACE [Indian National Space Promotion and Authorisation Centre]
- → ISRO [Indian Space Research Organisation]
#Key Space Facts
- ISRO = 2% [~2%] share in global space budget
- Budget = ~₹13,000 Cr
- → Space Tech Park
- → Outsourced 27 satellites manufacturing to private companies
- US → Falcon of SpaceX
- NASA's "Tipping Point" programme for partnership with private companies
#Satellite-Based Internet
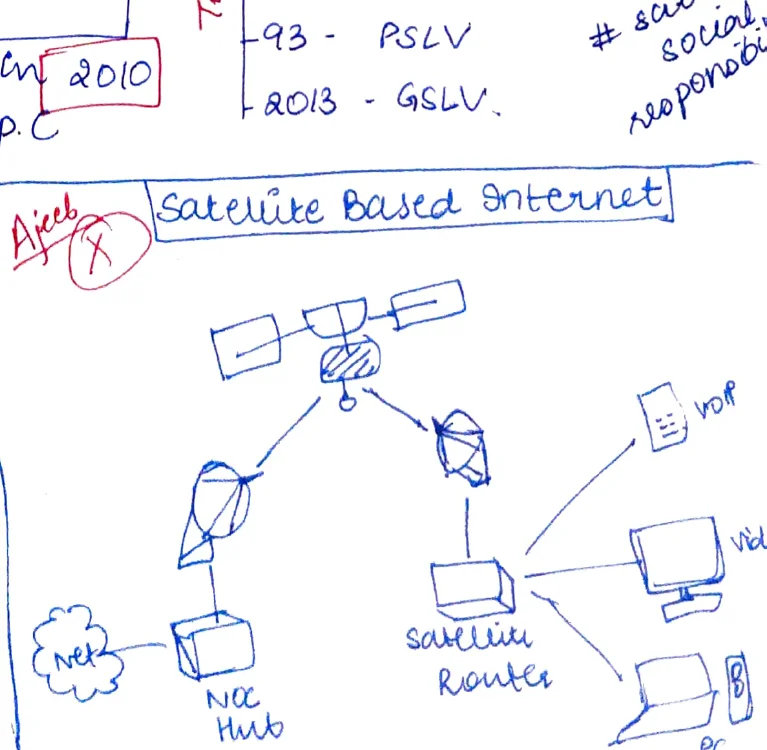
- Satellite → NCC Hub → Satellite Router → VoIP / Video / user devices
- Internet → NCC Hub [uplink] → Satellite → downlink to users
- Ajeeb [remarkable] — marked as [negative opinion: X]
#Lagrange Points
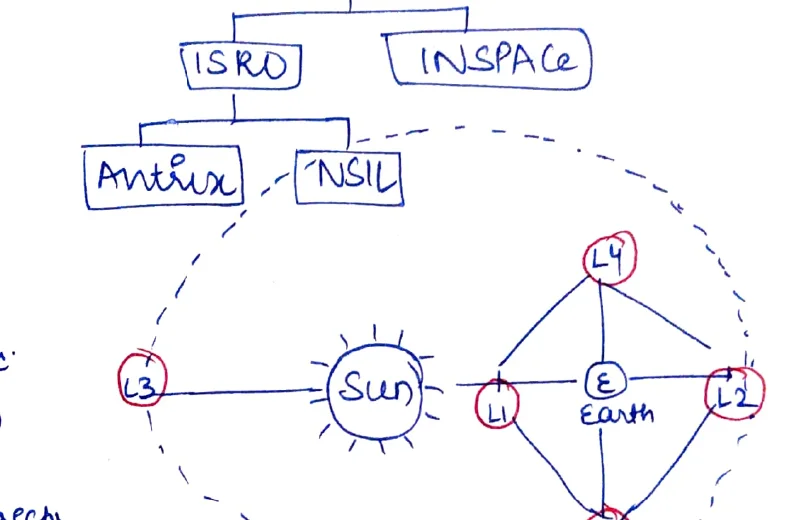
- Sun — L1 — Earth on horizontal axis
- L2 — beyond Earth (same orbital path)
- L3 — opposite side of Sun
- L4 — 60° ahead of Earth in orbit
- L5 — 60° behind Earth in orbit
- Aditya L1 → labelled with dashed line to L5 [marked with red circle]
- Note: Aditya-L1 is actually going to L1 — the notes mark L5 with a red circle (Aditya positioned near L1 on axis)
#Chandrayan 2 & Ritu Karidhal
- Ritu Karidhal — Chandrayan 2 Director ("Rocket Woman")
- Agnii VI [Agni VI missile — Women in Science connection]
#Women in Science
- 1/7 of 4.8 Lakh scientists in India are women
- 81% ISRO staff
- DISHA: KIRAN, Srushti, MANAC etc. [women scientist programmes]
- eg: Tessy Thomas — Missile woman (Agni VI)
#One Health Approach
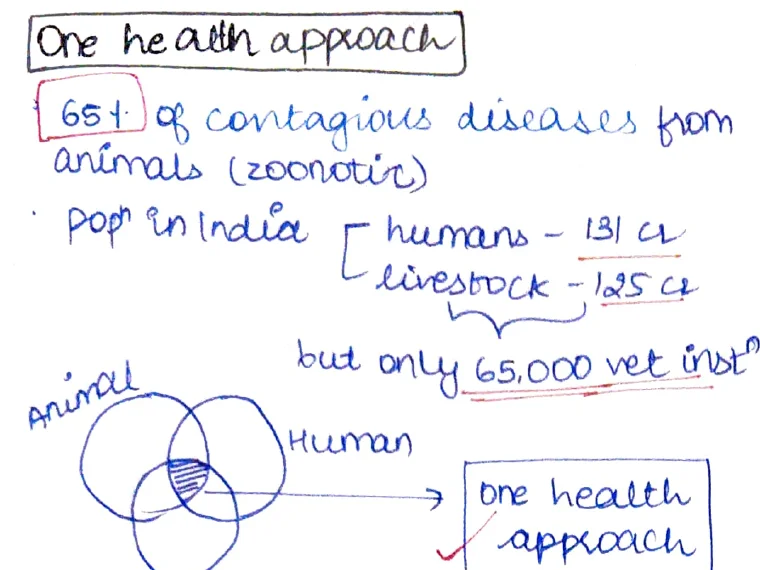
- 65% of contagious diseases from animals (zoonotic)
- Pop [Population] in India:
- Humans — 131 Cr
- Livestock — 125 Cr
- But only 65,000 vet [veterinary] institutions
- Three overlapping circles: Animal + Human + Environment → One Health Approach (intersection)
#Pharma / Healthcare
- ₹41 bn today → ₹120 bn by 2030 [ES 2020]
- #3 by volume
- #14 by value
- Pharmacy of the world
- Global share: 3.5% (1947) → [growing] (2020)
- 20% of all generic drugs
- 50% of vaccines
- 80% of AIDS drugs
- 68% API [Active Pharmaceutical Ingredient] from China
- 100% FDI in greenfield [pharma]
- 100 Cr → Med [Medical] Device Park
- 1000 Cr → Bulk Drugs Park
- PLIs @5% [Production Linked Incentive scheme]
#Big Data
- CAG BD [Big Data] Policy, 2016
- 3 Vs: Volume, Velocity, Variety
- Data Lake: SEBI [Securities & Exchange Board of India] / NHAI [National Highways Authority of India]
- Project Insight of IT Dept [Income Tax Dept's big data project]
- PSBN [ES 2020] — NDAP [National Data and Analytics Platform] by NITI [Aayog]
#Space (Aditya-L1 / Defence transition page)
- Aditya L1 → L5 [circled, dashed trajectory to L1 Lagrange point] — India's solar observatory mission
#Defence Technology
#Defence Timeline
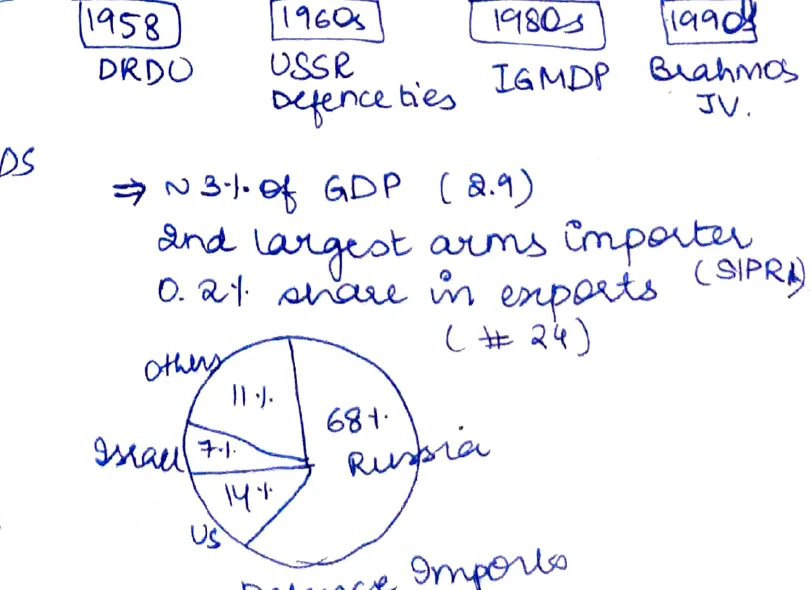
- 1958 — DRDO [Defence Research & Development Organisation] established
- 1960s — USSR Defence ties
- 1980s — IGMDP [Integrated Guided Missile Development Programme]
- 1990s — Brahmos JV [Joint Venture — India-Russia]
#Key Defence Statistics
- N 3.1% of GDP (2.9% actual) [defence spending]
- 2nd largest arms importer (SIPRA [SIPRI])
- 0.2% share in exports (#24 in world)
#Defence Imports Pie Chart
- Russia — 68%
- Israel — 7%
- US — 14%
- Others — 11%
- Caption: Defence Imports
#Problems in Defence
- (-) Dominance of PSUs [Public Sector Undertakings]
- (-) Low spending
- (-) Red tape
- (-) Defence planning [poor strategic planning]
#Defence Reforms (page 6)
#Steps Taken
- → 209 items in the Indigenisation list of import embargo
- → 74% FDI [in defence]
- → DAP 2020 ↑ indigenous content
- → Sep [Separate] capital procurement budget from 2021
- → IDEX [iDEX — Innovations for Defence Excellence] platform
- → Defence corridors (UP, TN) [Uttar Pradesh, Tamil Nadu]
- → AI-based interventions like EYESIRA [AI targeting/surveillance]
- → Replacing OFB [Ordnance Factory Board] with 7 new PSUs
#DAP 2020 [Defence Acquisition Procedure]
- List of weapons/platforms for import ban
- New category of Buy (Global — Mfr in India)
- Request for Info [RFI] to explore willingness of prospective foreign vendors
- Rev [Revision] in offset policy — removed for 1G & G2G [Government-to-Government] deals, single vendor contracts
- Project Mgmt Unit [PMU]
- Simplification of trial procedures
- Leasing — as new category for acquisition
- Atmanirbhar [Bharat — self-reliance in defence]
#Defence Procurement Categories Table
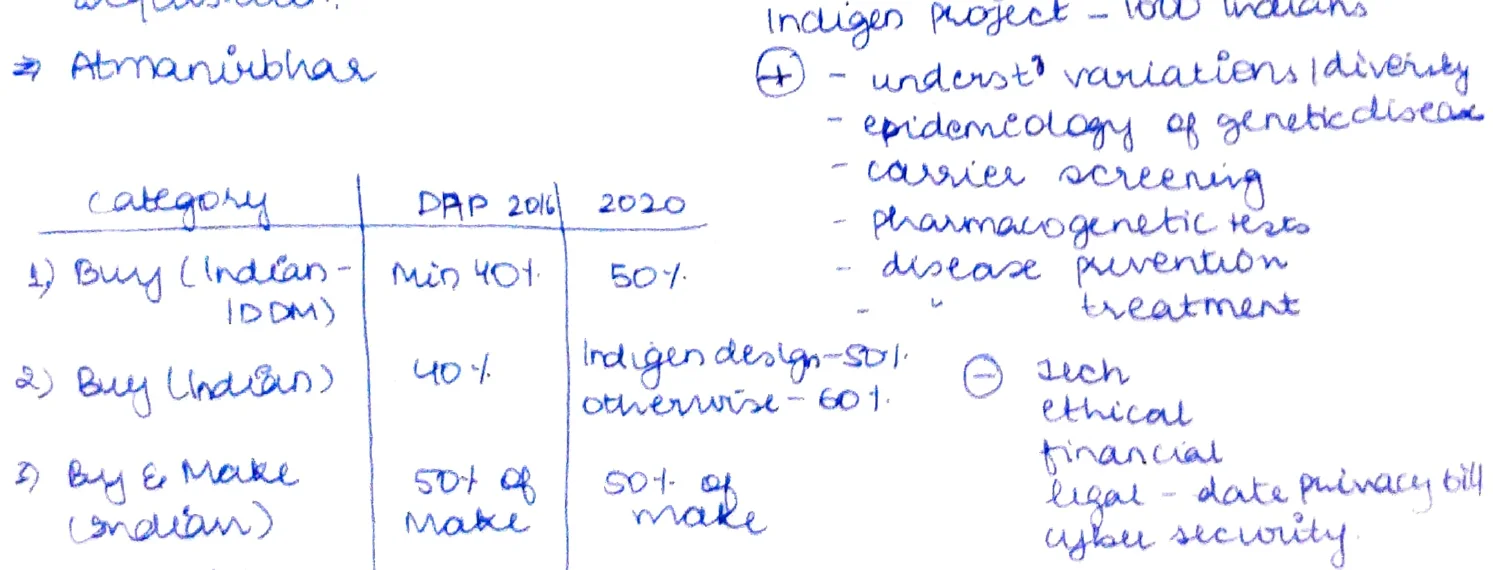
| Category | DAP 2016 | 2020 |
|---|---|---|
| 1) Buy (Indian – IDDM [Indigenous Design, Development & Manufacture]) | Min 40% | 50% |
| 2) Buy (Indian) | 40% | Indigenous design, otherwise 60% |
| 3) Buy & Make (Indian) | 50% of make | 50% of make |
| 4) Buy (Global – Mfr in India) | — | 50% of Buy & Make |
| 5) Buy (Global) | — | 30% for Indian vendors |
#Defence Spending
- 3rd largest military spender (~$73 bn USD)
- 4/3rd [ratio]: Capital vs Revenue
- 50% spent on foreign suppliers
- → 25 Lac DMF [Defence Manufacturing Fund] by 15th FC [Finance Commission]
- → SRIJAN portal [indigenisation portal]
#NFT (Non-Fungible Token)
- Wazir X [Indian crypto exchange] recently launched NFT marketplace for Indian artists
- = Unique proof of ownership of digital asset based on blockchain tech
- Unique, digitally rare, tradable — but not divisible
- (+) Ownership → eg: Jack Dorsey's Tweet
- → Authenticity
- → IPR protection
- → Monetization
#NFT Issues
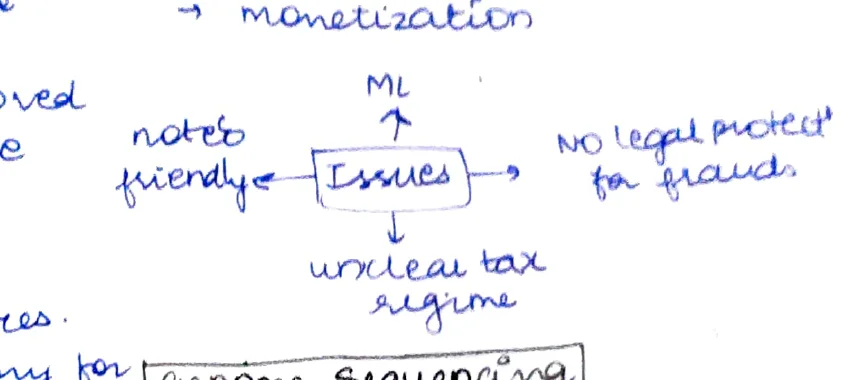
- ↑ ML [Machine Learning / Money Laundering — context: money laundering]
- ← Notes friendly [easy to use/record]
- → No legal protection for frauds
- ↓ Unclear tax regime
#Genome Sequencing
- IndiGen Project — 1000 Indians [sequenced]
- (+) Understand variations / diversity
- Epidemiology of genetic diseases
- Carrier screening
- Pharmacogenetic tests
- Disease prevention & treatment
- Issues (genome sequencing):
- (-) Tech
- (-) Ethical
- (-) Financial
- (-) Legal — Data Privacy Bill [pending legislation]
- (-) Cyber security
- (design-STL: se-60%?) [illegible marginal note]
#Satellite-Based Internet (additional detail)
- Ajeeb [marked with X — negative note by topper]
- Net → NCC [Network Control Centre] Hub → Satellite → Satellite Router → user devices [VoIP, Video, computers]
#Blockchain (Advantages box — right column p3)
- Value addition
- Governance
- No middle [men] = Transaction [cost down]
- Protection from fraud(s)
- Business process improvement
- [10% GDP] [stored/tracked via blockchain — WEF estimate]
- Stored [immutably]
- Transparency
#Patents / IPR (additional statistics)
- US → 1 patent for every 6,000 people
- China → every 25,000 people
- India → 1 for 600,000 people
- → 600 times bigger opportunity [for India to grow IP creation]
Environment
Topper handwritten notes#Page 1 — Key Facts, Reports & Constitutional Provisions
#Green GDP
- Green GDP — concept of factoring environmental costs into GDP calculations
#UN Decade on Ecosystem Restoration (2020–30)
- UN Decade on Ecosystem Restoration (2020–30)
- 8–4% land, 7–8% of species [covered / targeted]
#Invasive Species
- 4 phenotypic plasticity — alter growth form to suit conditions
- 12° pip — [illegible abbreviation] IAS [Invasive Alien Species] monitoring system
- Global IAS program
- 461 migratory birds in India
- GBO [Global Biodiversity Outlook] — 30×30 target — protect 30% of planet by 2030
- PMF [illegible] — proceed of INBT [illegible] to be w/w $3 and $33 billion/year globally
- During 2014–17, eastern states lost 1052 lives to elephants
- Conflict → coexistence
- SC upheld Madras HC order affirming animals' right of passage
#BIW 1973–2014 Shola Grasslands
- BIW [Biological Importance of Wetlands] 1973–2014, Shola grasslands ↑ by 66.7% [area increase]
- Polluter pays & Pay & Pollute approach
#UNESCO Report
- UNESCO Report [on water/education — context unclear]
- 1 in 3 is largest extractor of GW [groundwater]
- 751 MHH [million households] don't have drinking water at home
- 8(4?) rural HHs = no piped water
- 1 in 3 — water is contaminated
- By 2030, dd = [demand equals] 2× supply
- Loss of 6(%) of GDP
#Bon Bella Faura [Buen Vivir] — checks excessive acquisition & greed in Sundarbans
#Gadavarman Judgement of SC
- Gadavarman Judgement of SC — expanded scope of forest concern (1996)
- SC ordered cuts of CAMPA [Compensatory Afforestation Fund Management & Planning Authority] in 2001
#Manita Harath [illegible] 71–33+ [forests]
#Art. 21 (Right to Healthy Environment)
- Art. 21 — Right to healthy environment
- AURA — state shall protect & improve environment
- [Reference to Art. 48-A] — Directive: state shall protect & improve environment
#Globally, Ini Poli Koli
- Globally, Ini Poli [Air] Koli [Pollution?] kills 60 people every hour or 13 every minute
- Acc to INOEFCC [illegible], India will receive ₹11 billion every year from 2030–50 for effective climate action
#State of India's Environment 2019
- State of India's Environment 2019 [report highlights]:
- 30% land degraded
- 281 districts in plan 9 — states
- Lost [1.6 mn ha] of forest cover since 2000
- SDG 15 — land degraded neutral / desert
#EPI 2020 — 168th rank [out of countries]
#Key Quotes
- "What we are doing to the forests is but a mirror reflection of what we are doing to ourselves" — MK Gandhi
- "Ecology is permanent economy" — Sunderlal Bahuguna
#Green Skill Debt
- India generates 9.46 [mt?] (10mn tonnes) of plastic waste every year — [CPCB]
- 60(%) collected & [stored / covered in red]
- 16(%) stored in [illegible]
- 40(%) recycled / sent to end
- Total 782 jobs (?), 10% recycled
- Swata Cooling Action Plan (2021–31)
#Page 2 — Land Degradation: Causes, Effects, Impacts
#Causes of Land Degradation
- Deforest[ation]
- Overpopulation
- Pollution
- Natural disasters
- CC [Climate Change]
- Urban
- Industrial [with sub-note: 4 @ [symbol]]
- Agriculture
- Overgrazing
- Mining
- Hydropower projects / dev[elopment] projects
- IAS [Invasive Alien Species]
- Tourism
- Land use change @
- Road construction
#Effects of Land Degradation
- Human health
- Biod[iversity] loss
- Ozone
- Tourism
- CC [Climate Change]
- Poverty / eco effects
- Land degradation
- Food insecurity
- Water crisis — river, ecosystem
- Migration (pol[itical])
- Soil infertility
- ↑ Hazards
- Human wildlife conflict
- SLR [Sea Level Rise] / ocean acid[ification]
- Threatens livelihood
#Impact on [Biodiversity / Ecosystems]
- → Soil
- → Oceans
- → Ecosystem → marine / terrestrial / agro
- → Biod[iversity]
- → Atm[osphere]
- → Humans
- → Microorg[anisms]
#World Bank Report
- WB report shows that the world will lose 18% of GDP due to CC [Climate Change]
#Page 3 — Climate Change: India's Response, Pollution & Miscellaneous
#Climate-Smart PPP [Public Private Partnership]
- Climate-smart PPP
- Odisha Climate Action Plan (OCAP)
- One of the first states to prepare a comprehensive SAPCC [State Action Plan on Climate Change]
- Mumbai CAP
- Gujarat CCAP
- CIS — Climate Info Services
- IPCC — Assessment of CC over India:
- 0.5°C ↑ in avg T
- 10 SC ↑ in IOR [Indian Ocean Region]
- 15%↓ in glaciers in HKH [Hindu Kush Himalaya]
- 6–11 ↑ in summer monsoon
- Rainfall [illegible symbol] — Dec 4 [illegible]
- 75°F ↑ in frequency of localized heavy rain events
- ↑13–4 ↑ in area affected by drought
- Emission Gap Report, 2019:
- I = 4/7% of global emi[ssions] (1st page?)
- 3rd largest after US, China
- GRI8 approach — Green, Resilient & Inclusive Development
- Uttarakhand — 1st state to take into Ac [account] GEE while calculating GDP
#Greenpeace Report on Delhi Pollution
- USD [$1 bn to 13%] of Delhi's annual GDP
- 54,000 lives in 2020
- Justice Madan B. Lokur (retd. SC) GRAP, CAQM, SAFAR [Tree Policies] Red Light On, Gadi Off campaign, Wastepaper
#IUCN — 8mn tonne plastic waste ends up in oceans every year
- IUCN — 8mn tonne plastic waste ends up in oceans every year
- Acc. to UN, 9 out of 10 people on the planet breathe the polluted air
- Carbon-neutral mobility
- Agri & Livestock = 18(+)% of gross national emissions
#TNGoal — Cauvery Delta Region
- TNGoal — Cauvery Delta Region as a Protected Special Agri Zone
- Lakshadweep = organic UT
#SEA vs EIA
- SEA [Strategic Environmental Assessment] — makes long term, proactive decisions
- EIA [Environmental Impact Assessment] — project level, reactive
- Blending of 15% methanol in petrol will ↓ pollution by 33% & diesel replaced by methanol will ↓ by 80%
#Nature Based Solutions (NbS)
- Nature-based Solutions (NbS):
- Mangrove bill
- Reef restoration
- Agroforestry
#Community Para[lels]
- Community para[lels]: Bishnoi of Raj[asthan], Soliya, GRT TR, Balga — Kanha
#Anthropocene / Age of Humans
- Anthropocene / Age of Humans (1900 onwards)
#Page 4 — Nitrogen Cycle, ESZs, PA [Protected Areas], Landfills
#Nitrogen Cycle
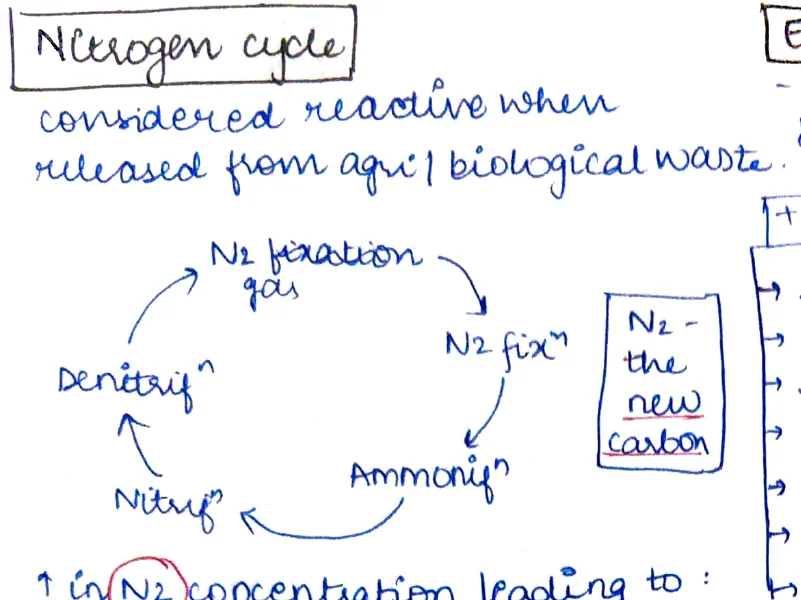
- Nitrogen cycle — considered reactive when released from agri/biological waste
- N2 fixation (gas)
- → N2 fix[ation]
- → Ammonif[ication]
- → Nitrif[ication]
- → Denitrif[ication] (back to N2)
- N2 — the new carbon
- ↑ in [N2] concentration leading to:
- Nutrient imbalance in trees
- Hypoxia (low O₂) / anoxia (no O₂) → algal blooms
- NO₃ contrib[utes] to PM 2.5 & ozone pollution
- Respiratory diseases
- Haze in winters
- Soil leaching
- Nitrates in GW → Blue baby [methemoglobinemia]
- ↑ parasitic & infectious diseases
- Poll[ution]
- School shutdown
- Loss of Biod[iversity]
- ↑ health exp[enditure]
#UNEP 2019 Colombo Plan — Indian N Assessment (2019)
- 70% of total N2 emi from India
- Agriculture: [illegible]%, [largest sector]
- Burning: [illegible]%
- Sources: [illegible]
- 51% of N, 4% So2 in the world
- 7% of CO₂
#ESZs [Eco-Sensitive Zones]
- ~10km around NP/WLS u/1986 Act
- By GoI based on:
- Endemism
- Eco vulnerability
- Geomorph[ology]
Issues with ESZs
- Shock absorber
- Bs [Buffer zone] — actual conflict
- Forest depletion
- Regulatory, yet prohibitive
- Balance b/w env & dev[elopment]
- WG ecology [Working Group on Ecology]
VPA [Village Panchayat / Village Protection Area] issues
- Restricts land use &
- ↑% impact on [local] pop[ulation]
- Locals excluded from process
- C-B-T strategy already
- Against cultural models of conserv[ation]
- No quantifiable criteria
- Resistance by SG [State Government]
#Landfills
- FPCB: Delhi = 8700 tonnes SW/day
- HG of Ghazipur [landfill] is almost equal to Qutab Minar
- Incineration
- Composting
- Biorem[ediation] / biominig [biomining]
Not Eco-friendly [landfills]:
- Expensive
- Renewable material recovery
- Land reclaim of 3+ [illegible] years; 100 acres land
- Poll[ution] (soil/gw)
Issues:
- Degree of waste
- Longer specific conv[ersion time?]
#Concern → air pollution / gas pollution (leaching?) / [illegible] problems / fire hazards
#Page 5 — Dams, FRA [Forest Rights Act], OSOWOG, Hydropower Challenges
#Dams
- 95% dams don't have emergency plan
- China > US > I [India]
- ↑ & ↓ in no. of dams
- ↑ WB = Rs 250mn — DRIP II [Dam Rehabilitation and Improvement Project]
- 2012 CSS — several sectors
Issues with Dams — Structural:
- Structural — Ageing & forecasting system
- Implement[ation]:
- No monitoring
- No trained manpower
- No funds (DRMs?)
- Envir[onmental]:
- Flood risk
- SLR [?]
- Soil erosion
- Species extinction
- Social — [illegible] that dam [affects] 11 people … human displacement 11 people
- DHARMA Dam Safety Act 2019
- Inundation maps, DIA [Design Inspection Agency] collaboration
FRA 2006 vs FRA 2020 [comparison]:
| FRA 2006 | FRA 2020 |
|---|---|
| No | Post-facto approval 20 days |
| Pub[lic] hearing 30d | Once a year |
| Compliance report every 6m | Strategic projects |
| No | Violations reported only by project proponent / EIAC on govt/reg auth |
| Community power |
FRA Rights:
- Title — upon title
- Community — grazing, fishing, IFF [illegible] / MFP [Minor Forest Produce]
- Relief & Dev — Rehab
- Forest mgmt. (natural mode)
+ve [Positives of FRA]:
- Reversing historical injustice
- Curbing extremism
- Forest conservation
- Decentralal[isation]
Issues with FRA:
- High rejection of claims
- No awareness
- Diversion of tribal land ("0.33mn ha so far")
- No pol will
- Forest [illegible] piracy
- No capacity of GS / SD
Problems with EIA:
- Precautionary? Madras HC 2021 struck down pt [point] of clearances in TN
- [Illegible] bangs / posts
- Irreversible damage?
- Against spirit of law
- Natural justice
#OSOWOG [One Sun One World One Grid]
- OSOWOG:
- Phase 1 — [illegible]
- Phase 2 — Africa, SE Asia
- Phase 3 — [illegible]
- A tool for global cooperation in building a global ecosystem of interconnected renewable energy
- Eg: ↑ eff[iciency] by 1 asset util[isation?]
- Attract investment in renewable energy
- India's leadership role
- Energy for all (SDG-7)
- Seamless flow
- Phase Map [referenced]
Challenges:
- Cyber threats
- Unpredictable supply
- Tech / skills / finance
- Regional politics
- Regulatory hurdles due to multiple jurisdictions
- Sharing of CO₂
#FRA 2006 [detailed provisions]:
- Preempt road → fall land before [illegible]
- 2 limit relax
- Means sl [illegible] to leave forest land to live next to corp[oration]
- Creation of no-go areas where specific projects would not be allowed
- Deforestation [illegible] divergence projects non-[illegible]
- Some by absence projects non-[illegible]
- Good up [illegible] diverse micro-aggrec[?] project tracking of [illegible] construction of (cost = [illegible])
#Page 6 — Urban Forestry, Plastics, SUPs [Single Use Plastics], Renewable Energy
#Urban Forestry
- Urban dev[elopment] guidelines 2014 suggest a norm of 10–12 sq [metres?] of open space per person
Importance of Urban Forestry:
- Microclimate & urban heat island effect
- Carbon sequestration
- Bird [habitat]
- Urban hydro cycle
- Check haphazard urban aesthetics
- ↓ stress & mental alertness
- Educ[ation?] — flora & fauna
- Recreation
- Cultural regeneration
- Work oppo[rtunities]
- ↓ energy demand
- ~200 urban forests in India
- Nagar Van Scheme (Waste bin? lf[?]) [initiative]
- Manita Harath [illegible] prog. TL
- Tree city of W. Hyrd[erabad]
- 22/30 most polluted cities in India — Delhi is w/s [worst] most polluted capital city
#PWM [Plastic Waste Management] Amendment Rules, 2021
- Thickness — 35 – wet Sep[tember] 202[illegible], 140 – Dec 2022
- EPR [Extended Producer Responsibility]
- CPCB to monitor
- State & UT Task Force
Challenges with Plastics:
- Easy avail[ability]
- Large consumption
- Oppo[rtunity] by industry
- Infra & tech
- Behavioural Δ [change]
- No RED [no reduction incentive]
- COVID — huge biomed waste
Indonesia — ban ride; @ Korea — Precycling [pre-cycling] — BYO mug bags
#WF [Waste Framework / Waste Management]:
- Most favoured [hierarchy]:
- Reduce
- Reuse
- Recycle
- Recovery
- Landfill (least favoured)
- + Circular plastic economy
#Plastics
- 9.46 MT plastic → 60% recycled
- Why ban SUP [Single Use Plastic]?:
- Not easy to recycle
- Huge footprint
- Made from fossil fuels
- Carcinogenic
- Leaches into food / drinks
- Enters food chain
- Kills animals
- Pollutes oceans (8mn – IUCN)
- High energy in prod[uction]
#Renewable Energy — Challenges:
- Land acquisition
- High initial cost
- Skilled labour
- Grid integration
- Tech backwardness [backwardness]
- Intermittent & — power storage & application
- [Segregate — solar, wind … are 5n demand (symbol)] [illegible]
#Page 7 — EIA Process, Sand Mining, Decarbonising Transport, SEA
#EIA [Environmental Impact Assessment] Process
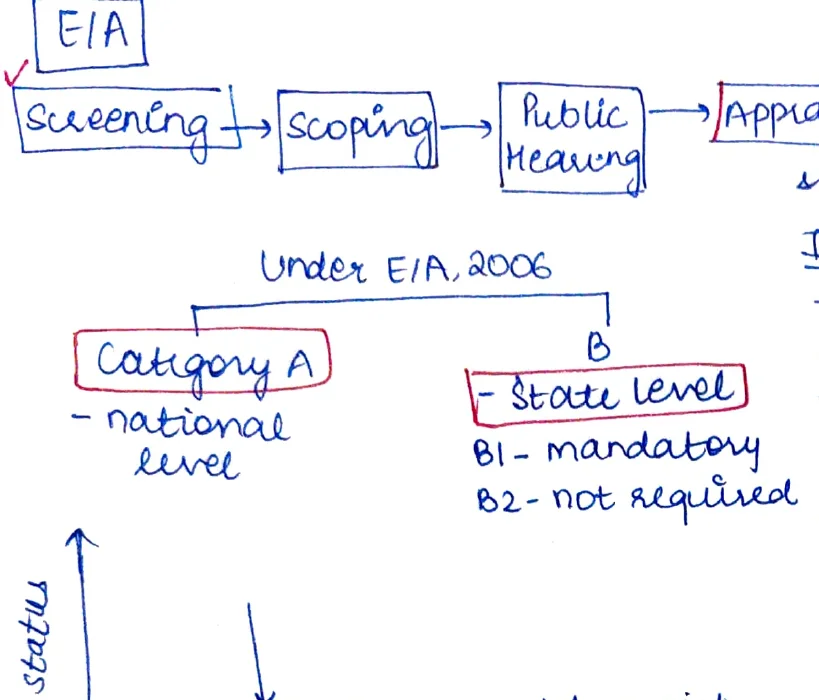
- EIA process under EIA 2006:
- Screening → Scoping → Public Hearing → Appraisal
- Category A — national level
- Category B — state level:
- B1 — mandatory
- B2 — not required
- [Graph shows]: "WoD [without] project" vs "with EIA" — env[ironmental] status over time — steeper decline without EIA, gentler with EIA
Drawbacks of EIA:
-
Several exemptions
-
Composition of C[committee?]
-
Quality
-
Pub[lic] hearing
-
Conflict of interest
-
No centralised baseline database
-
No accreditation of EIA consultants
-
[EInv?] supplement plan, 2016?
-
417 NGT cases are about faulty EIA
-
↑ promotes Pay & Pollute over Polluter Pays
#SEA [Strategic Environmental Assessment]
- SEA (Strategic Env[ironmental] Assess[ment]) — a tool to identify SEE [Strategic Environmental Evaluation?] impacts of a project before CM [Construction / decision-making?]
#Sand Mining
- Removal of sand from shore of rivers / lakes
Impact of Sand Mining:
- Coastal erosion
- Coastal floods
- Saline water intrusion
- Aquatic ecosystem
- Loss of barriers against SLR [Sea Level Rise]
- Depletion of GW [groundwater] table
- Agri threatened
- Species — miffer [suffer?] — eg: gharial, olive Ridley [turtle]
- Threat to livelihoods
- Eg: Tuticorin coast, KN [Karnataka?] etc.
- NGT ordered 1000 pins on AP for traction
- Bihar banned sand mining near river bridges recently
Sol [Solution]:
- M-sand [Manufactured sand], CR2 [?] — use fly ash, periodic assessment, surveillance
- Guidelines 2020
#Decarbonising Transport
- NIT [?] 1(47) [reference number]
- 3rd most CO₂ emitting sector
- W/in transport: Road = 90% of total emi[ssions]
- Vehicles on road: need to double by 800mn by 2030
- =51% ↓ Delhi/NCR poll[ution] from vehicular emi[ssions] — CSE
Sustainable Mobility:
- Air poll[ution] ↓
- Health problems ↓
- Make in India
- ↑ innov[ation?]
- ↑ Public transport
- Int[ernational] goals [met]
- Eg: BSV1, FAME, PLUS, MRTS [schemes/standards]
- NITI [Aayog] [TF?] → DT [dedicated transport?] in India project
#Page 8 — Glaciers, River Sinking, Eutrophication, Desertification, Delhi Pollution, CC Feedback
#Melting of Glaciers
![Melting of Glaciers — positive feedback cycle: Melting of sea ice → Exposure of dark water → Absorption of more sunlight → [back to melting]](assets/img/environment_p8_01.webp)
- Melting of glaciers — positive feedback cycle:
- Melting of sea ice → Exposure of dark water → Absorption of more sunlight → back to melting
- Melting of sea ice (separate branch — above)
#Eutrophication
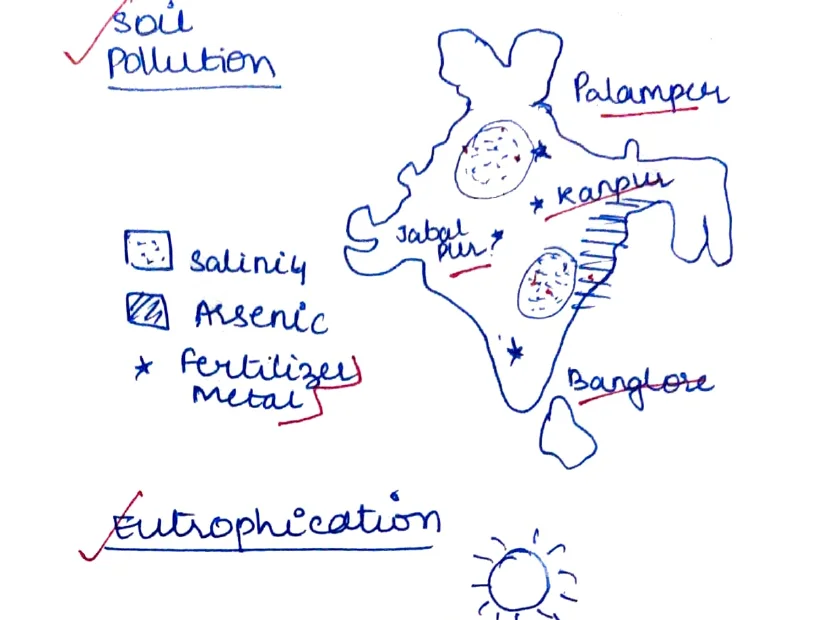
- Eutrophication cycle:
- Excess nutrients [enter water] → algal bloom → decomposers [break down] → O₂ depletion (anoxia) → plant growth → [cycle continues]
- Diagram shows: algae bloom → decomposers → [algae/plants]
#River Sinking — India Map
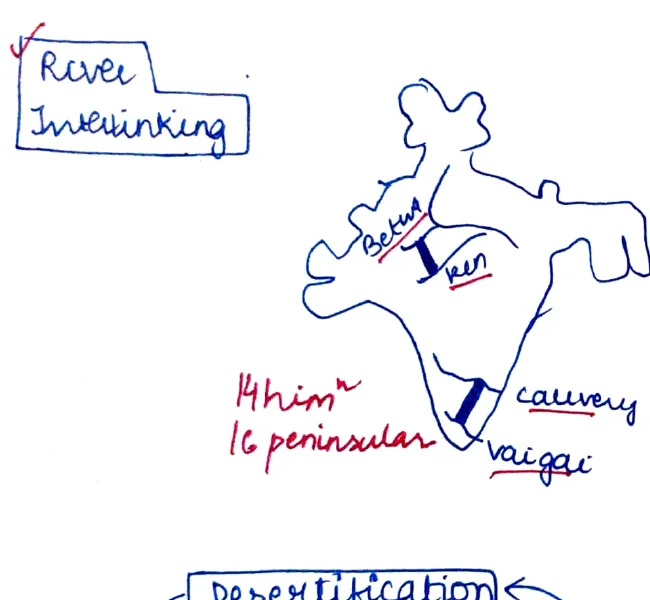
- River Sinking [map of India]:
- Atkim [?] — peninsula / west
- Cauvery
- Vargi [?]
- Soil Pollution [map of India]:
- Palampur — salinity / [symbol]
- Kanpur — arsenic / [symbol]
- Bangalore — fertilizers / metals / [symbol]
#Desertification + Delhi Pollution Pie + Population Overshoot
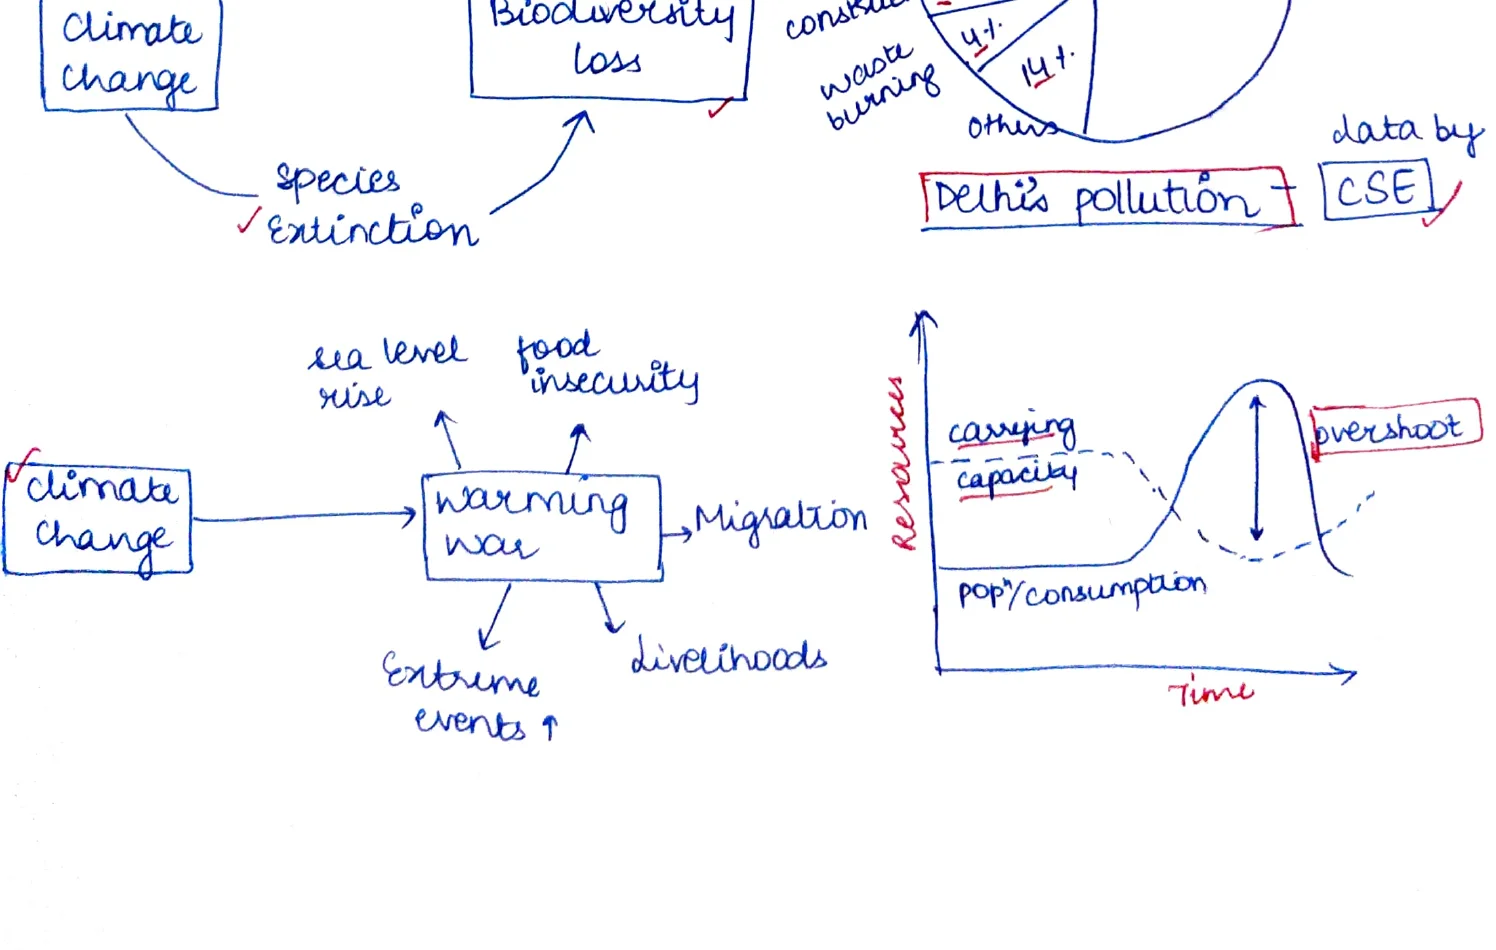
Desertification
- Desertification flowchart:
- Carbon sequester ↓ → Climate change → Biodiversity loss → Species extinction [cycle]
- Soil conserv[ation] [link]
Delhi Pollution — Pie Chart (data by CSE)
- 54% — vehicular emission
- 9% — [dust / industry?]
- 8% — bio[mass] burning
- 6% — [crop burning?]
- 1% — other [smaller slices: MH, oil, others]
Climate Change → Resource Wars / Migration / Livelihood Loss
- Climate change flowchart:
- → sea level rise
- → food insecurity
- → Increasing war → migration → livelihoods [affected]
- → extreme events ↑
Population Overshoot Graph
- Graph shows: carrying capacity (horizontal dashed line) vs pop[ulation]/consumption rising curve — overshoot beyond carrying capacity over time
#Page 9 — Land Degradation Data, Feedback Loop, Installed Capacity (Renewable Energy), SONATA Map, Panchtatva Principles
#Land Degradation — Bar Chart (2018–19)
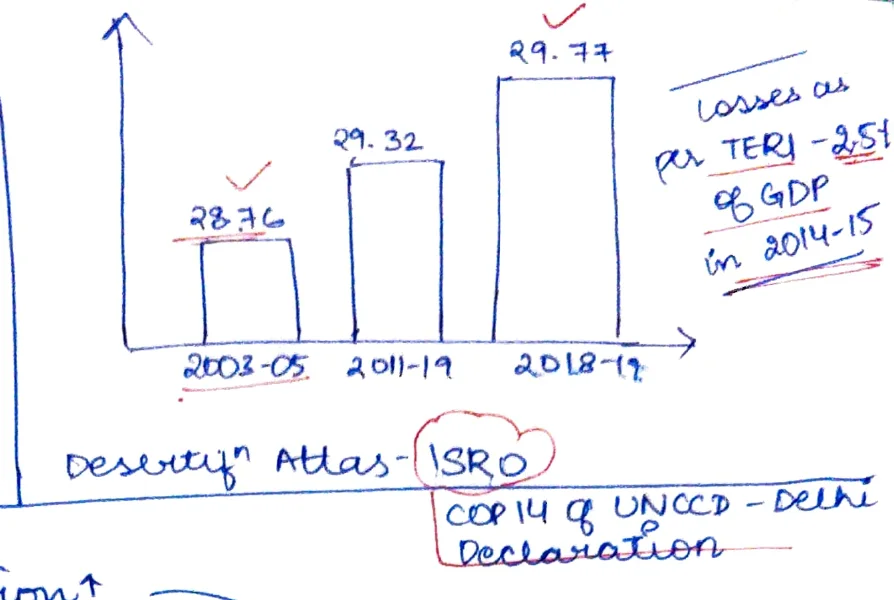
- Land degraded [2018–19]:
- Losses as per TERI — 2.5% [of GDP]
- 2004–05: 28.7 [₹bn?]
- 2011–19: 29–32
- 2018–19: R9–77
- GDP 2014–15 figures
- Losses as per TERI — 2.5% [of GDP]
- Desertif[ication] Atlas — ISRO
- COP14 & UNCCD — Delhi Declaration
#Land Degradation — Feedback Loop Flowchart
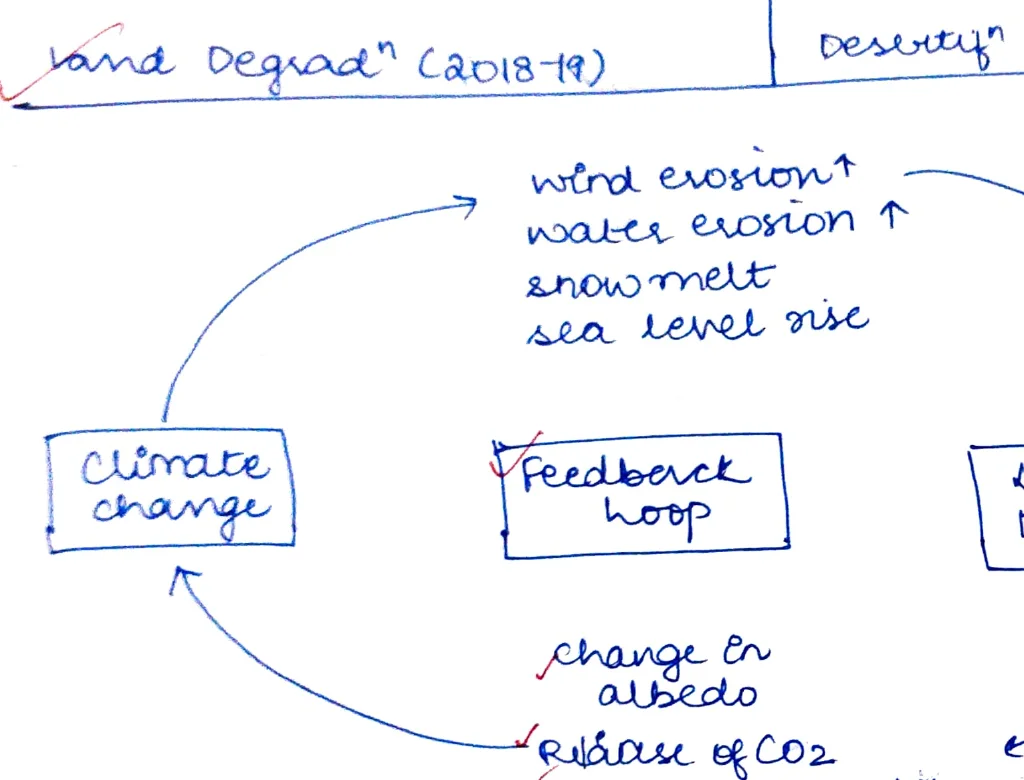
- Land Degradation Feedback Loop:
- Climate change:
- → wind erosion ↑
- → water erosion ↑
- → snowmelt
- → sea level rise
- → Land Degradation
- → change in albedo
- → release of CO₂
- → reliance on fertilizers
- → back to climate change [positive feedback]
- Climate change:
- Terrestrial, aquatic, wetland map [annotations on diagram]
#5th GBO [Global Biodiversity Outlook] Report
- 5th GBO Report:
- 6 "defenses" in 33% [of land?] (last decade)
- Protect land — 10–15%
- Protect area:
- Land = 10–15%
- Ocean = 7–4% [illegible]
#Installed Capacity — Pie Chart (September 2021)
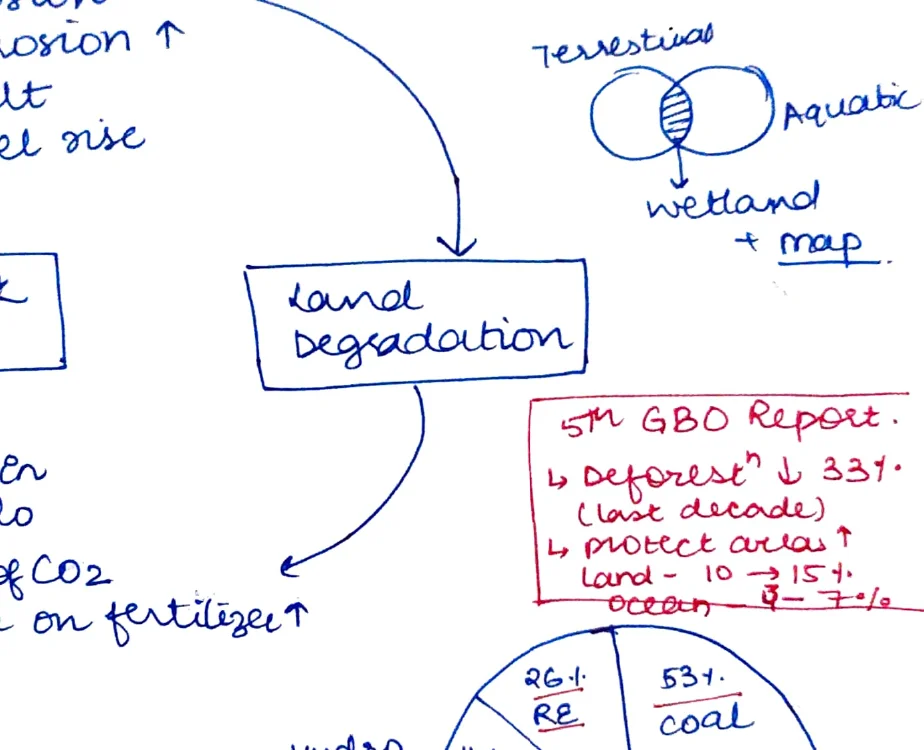
- Installed Capacity (Sept 2021):
- Coal: 53%
- RE [Renewable Energy]: 26%
- Hydro: 11%
- Gas: 6%
- Nuclear: 1%
- Diesel: ~0%
- Other: [illegible]%
#India Geothermal Map — SONATA
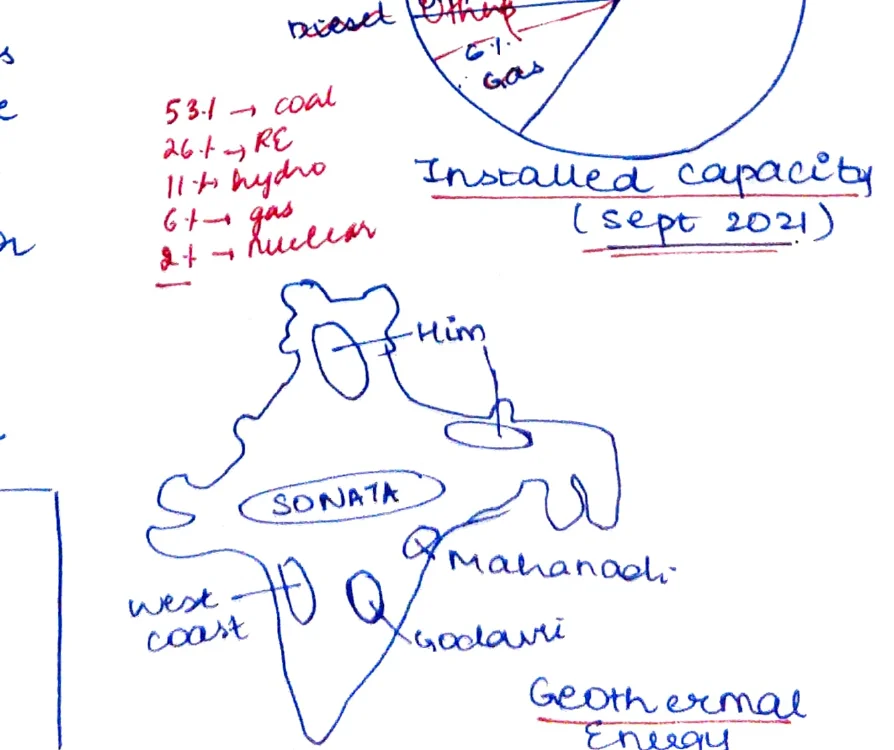
- India Geothermal SONATA [map]:
- Him[alayan region] — north
- West coast
- Mahanadi
- Godavari / [Deccan?] — east coast
- Geothermal energy sites labelled
#Panchtatva Principles of Sustainable Development (NITI [Aayog])
- Mix of P2, P3, P4 projects
- Budgetary plan to state optimum public value
- Create conducive envir[onment] for private participation
- People participation
- Development strategy
#Economy–Equity–Environment [Triple-E Venn diagram]
- Economy [circle]
- Equity [circle]
- Environment [circle]
- Centre overlap: X [intersection / balance point]
- → Engagement
#Page 10 — Climate Change: 9 Tipping Points (World Map), Food Security, CBAM, Green Growth
#Irreversible Changes — 9 Tipping Points
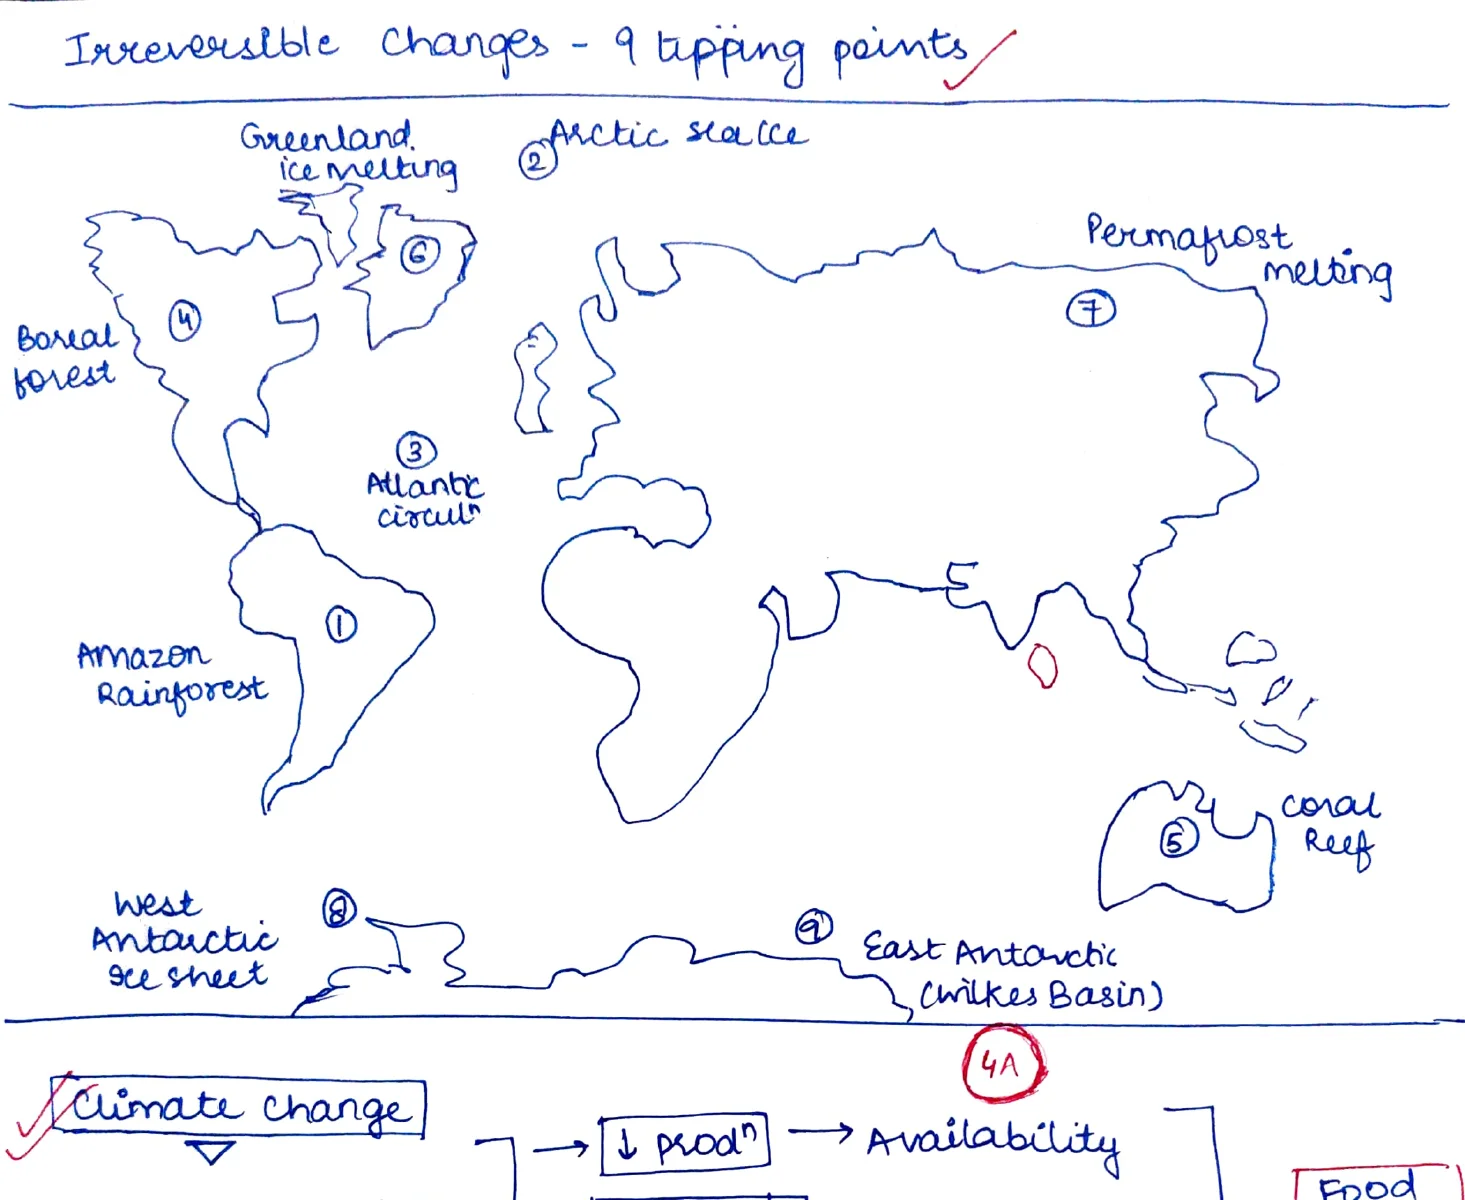
- 9 Tipping Points [on world map]:
- Greenland ice melting (north)
- Boreal forest (Russia / Canada)
- Amazon rainforest (South America)
- West Antarctic ice sheet (south-west)
- Atlantic circuit[s] / AMOC [Atlantic Meridional Overturning Circulation]
- Coral reef (Aus[tralia] — east)
- East Antarctica (Wilkes Basin) (south-east)
- Permafrost melting (Siberia / north)
- Arctic sea ice (far north)
#Climate Change → Food Security — Flowchart
![Flowchart: Climate change (extreme weather events & variability in rainfall) → ↓ prod[uction] → Availability; → ↑ prices & income → Affordability; → ↑ Diseases → Absorption; → ↑ Disruption → Accessibility → [all] → Food Security](assets/img/environment_p10_02.webp)
- Climate Change → Food Security linkage:
- Extreme weather events & variability in rainfall [input]
- → ↓ Prod[uction] → Availability
- → ↑ Prices & Income → Affordability
- → ↑ Diseases → Absorption
- → ↑ Disruption → Accessibility
- All → Food Security
#SDGS — Non Fossil Energy
- 500GW non fossil energy
- SDI energy from renewable
- Increased CO₂ — at COP26 Glasgow:
- → ↓ carbon emissions by 1bn tonne
- Net Zero by 2070
- → ↓ Carbon intensity by 45% by 2030
#CBAM [Carbon Border Adjustment Mechanism]
![Venn diagram: EU supplies → Buys [goods]; Non-EU → Buys [goods]; CBAM sits at intersection; Social impact / Green growth / Economic progress / Sustainable food system Venn](assets/img/environment_p10_03.webp)
- EU supplies → Buys
- Non-EU → Buys
- CBAM [Carbon Border Adjustment Mechanism]:
- EU tool to level carbon price on imports
- Social impact [circle]
- Green growth [circle]
- Economic progress [circle]
- Sustainable food system [outer circle]
- [Venn shows intersection of all three = sustainable food system]
#Page 11 — Hydropower in Himalayas, Role of Info in DM [Disaster Management], FCA [Forest Conservation Act] Amendment, Damage Types
#Hydropower in Himalayas
- Most projects ≠ HP along Satluj valley even when 4(?) of state is prone to landslides [symbol]
Why [concerns with Himalayan Hydro]?:
- Knowledge gap
- Absence of baseline data
- Geostrategic water war with neighbours
- Co-benefits justify
What to do?:
- SEA [Strategic Environmental Assessment]
- Remove subsidies for hydropower
- TPA [Third Party Assessment?]
- "Eco of the world" [reference]
#Corals — UN Report
- Corals — UN report:
- 32% threatened
- Destroyed with no hope for recovery
- 24% under immediate risk of collapse
- 26% at risk due to longer-term threats
#Role of Info in DM [Disaster Management]
- Disaster prevention & planning
- Local database on land use, demography etc → D [D = planning?]
- GIS in mapping, creating hazard maps
- Use by SDMA/DDMA to improve quality of EWS [Early Warning System]
- Info dissemination
- Info helps to coord[inate] among diff agencies
During Disaster:
- Info dissemination in local language
- For relief & rescue operations
- Social media to generate resources / agenda setting
- Improves situational awareness
- Help in tackling medical emergency
Post-Disaster:
- For redevelopment plans
- Real time monitoring
- Better targeting
- Assessment of loss
- Creating future strategy
#Risk-Informed Dev[elopment]
- Disaster database
- Disaster governance
- Disaster knowledge network
- Best practices
#26 tonnes of Covid-19 waste a day in India
- 26 tonnes of Covid-19 waste a day in addn to 614 tonnes of BMW [Bio-Medical Waste] produced earlier — CPCB via its BMW App
#FCA [Forest Conservation Act] Amendment
- Preempt road → fall land before [illegible]
- 2 limit relax
- Means sl [sic] to leave forest land to live next to corp[oration]
- Creation of no-go areas where specific projects would not be allowed
- [Illegible] divergence projects non-limit
- Some by absence projects non-[illegible]
- Good up [illegible] diverse micro-aggre[gation?] project tracking of [cost?] construction
#Damage Types Table
| Primary | Secondary | Tertiary |
|---|---|---|
| MRFA [?] | Other diseases | PTSD |
| Lives | Public health exposure | [illegible] |
#Page 12 — Agriculture & Climate Change, Energy Security, Emission Trading, Climate Justice, Urban Waste Mining, Rainbow Deal
#Agriculture & Climate Change — Feedback Cycle
![Cycle diagram: Rise in temp → Amazon fires / Drought & wildfire → forests release CO₂ → more water in atm → Rise in temp [loop]; GHG, chemical use, soil, water, crop management → Agriculture ↔ Climate Change → impacts rainfall, temp, pests, pollution causing ↓ prod](assets/img/environment_p12_01.webp)
- Agriculture ↔ Climate Change — bidirectional feedback:
- Rise in temp → Amazon fires / Drought & wildfire → forests release CO₂ → more water in atm → back to rise in temp
- GHG, chemical use, soil, water, crop management [inputs to agriculture]
- Agriculture [impacts] → Climate change
- Climate change [impacts] → rainfall, temp, pests, pollution causing ↓ prod[uction]
- → CSA [Climate Smart Agriculture] [as response]
#Energy Security — Pyramid / Triangle
![Energy security triangle/pyramid: High demand + High impacts → environmentally friendly; Equity / Need for [illegible] at bottom; 21st century challenges & critical demands require a balance with economy; Economies of scale (cost of tech) on right](assets/img/environment_p12_02.webp)
- Energy Security pyramid:
- High demand + High impacts → Environmentally friendly [apex]
- Equity [middle level]
- Energy Dilemma [base note]
- 21st century challenges & critical demands — require a balance with economy
- Economies of scale (↓ cost) ↔ [illegible] (↑ cost for sustainability)
#Emission Trading
![Emission Trading diagram: Industry A and B; Carbon MKT at centre; Excess [credits] → saved; Allotted emission limit; A buys / B sells based on under/over emission](assets/img/environment_p12_03.webp)
- Emission Trading system:
- Industry A and Industry B in market
- Carbon MKT [Market] at centre
- Allotted emission limit per industry
- Excess [below limit] → saved / sold
- A buys [credits], B [sells credits] — based on under/over emission performance
- Gujarat gives [first?] for Surat textile industry in 2019 [illegible symbol]
#Heat Dome — Pacific / Atlantic
- Heat dome — [illegible] pushes air [down?] trapping heat
- Same of all districts — [illegible?] surrounding
- Pacific Ocean — North America — Atlantic Ocean [heat dome map sketch]
#Climate Injustice — Table / Pyramid
| Level | Per capita [CO₂ / consumption] | Descriptor |
|---|---|---|
| 10–7 | 2 [tonnes?] | Rich |
| 6–6 | [illegible] | [illegible] |
| 2–7 | middle | 3 crore |
| [lower] | low | [countries?] |
| CO₂ per capita | low | countries |
- Climate Injustice — those who emit least suffer most
- [Pyramid shows rich at top consuming most, poor at bottom emitting least but most affected]
#Urban Waste Mining / E-Waste
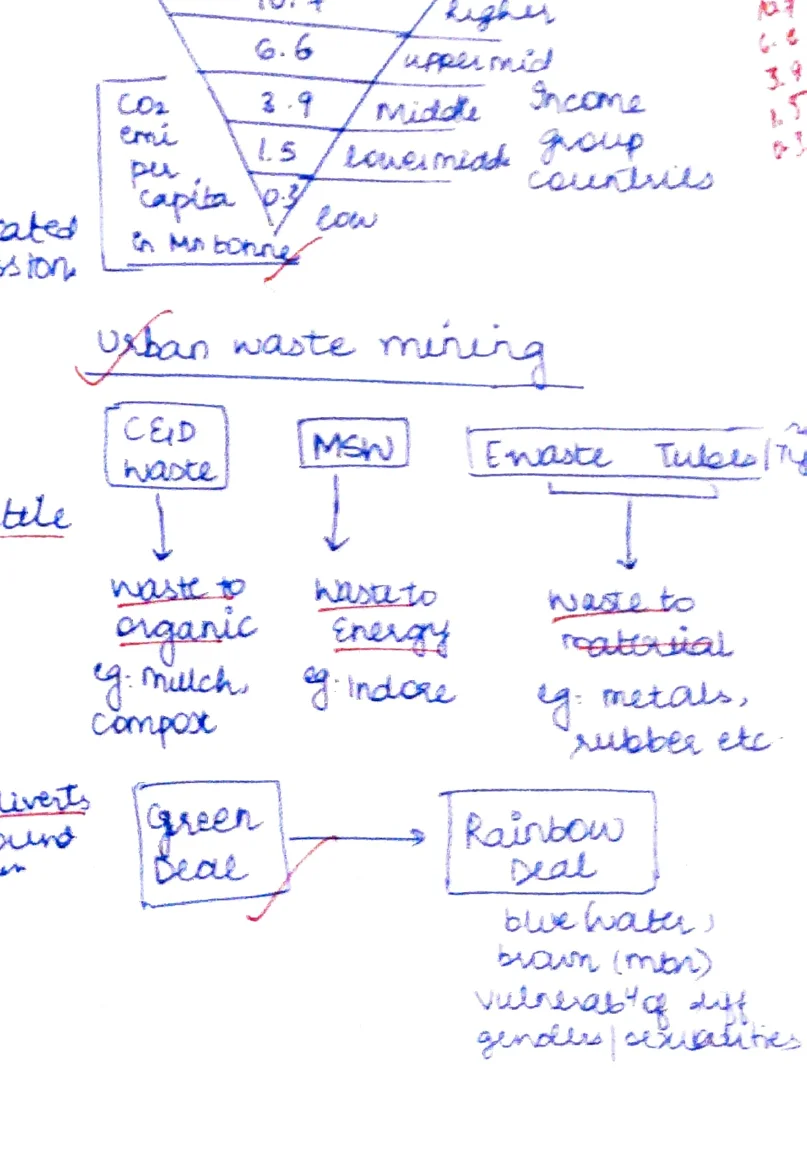
- Urban waste mining:
- E-waste:
- → Waste to organic — eg mulch, compost → holistic energy (G indices)
- → Waste to material — eg metals, rubber etc → Rainbow Deal
- Green Deal [EU] → Rainbow Deal [beyond EU]
- Rainbow Deal elements:
- Blue holders
- Susan (msg?) [illegible]
- [illegible]
- Genetic [illegible]
- E-waste:
Disaster Management
Topper handwritten notes#Page 1 — Overview, Framework, Challenges, Phases, Institutional Structure
#Vision / Objective
- Vision as per NDMP 2016: to make India Disaster Resilient across all sectors
- NDMA – 2006 (established)
- NDPM – 2009 (Policy)
- NDMP – 2016 (Plan)
- Note top-right corner: "PA pencip in Paper II notes" [reference to related content in Paper II]
#What is Needed? (Reform Agenda)
- Institutional support of MST [Multi-Stakeholder Teams] for DM (and ARC [Administrative Reforms Commission])
- Professionalise DM
- Mass + Social Media involvement
- CBDM [Community-Based Disaster Management]
- District DM Plan
- Include DM in list III [Concurrent List of Constitution]
- Total Risk Management [TRM]
- Sustainable Debt
- Leverage tech + data-driven approaches
- Inter-agency coord [coordination] as [~1/CA — illegible fraction] & cloud-based [illegible end of line]
- Agro Forestry
#Challenges (General)
- CC [Climate Change]
- Weak compliance of policies
- Asymmetric impact
- Fund mobilí? – NDMF? [National Disaster Mitigation Fund – query mark in original]
- No specific targets in NDMP
- Infra gaps
- Trained manpower shortage
- Low CBDM [Community-Based Disaster Management]
#India's Vulnerability
- 85%+ of country is vulnerable to single or multiple disasters
- 58% – seismicity / earthquake-prone
- 68% – drought
- 8% – cyclone / 76% of coastline
- 18% – floods
#New Age Disasters
- Refugee crisis
- Air pollution
- Terrorism
- Communal / religious riots [communal neighbour riots]
- Road accidents
- Pol [Political] crisis → hunger / famine
#Disaster–Debt Relation (→ PA [Public Administration])
- Joad [Joint] Response → NDMF [National Disaster Management Fund]
- Central: top-down, stay of relief, reactive, outside response, sequence of action, top down
- Decentralised: quality, proactive, community resilience, parallel series of acts, bottom up
#Phases of DM
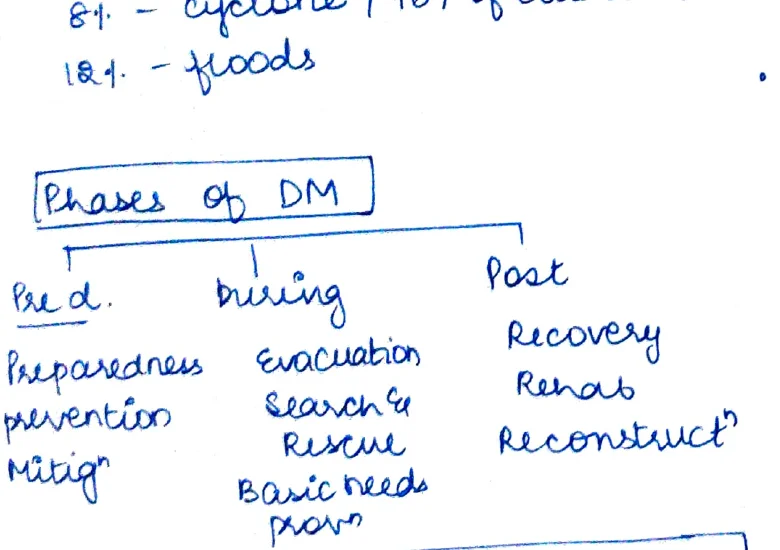
- Pre-disaster
- Preparedness
- Prevention
- Mitigation [Mitig'n]
- During
- Evacuation
- Search & Rescue
- Basic Needs Provision [prov'n]
- Post
- Recovery
- Rehab [Rehabilitation]
- Reconstruct [Reconstruction]
#Disaster Cycle Diagram + Safety / Institutional Culture
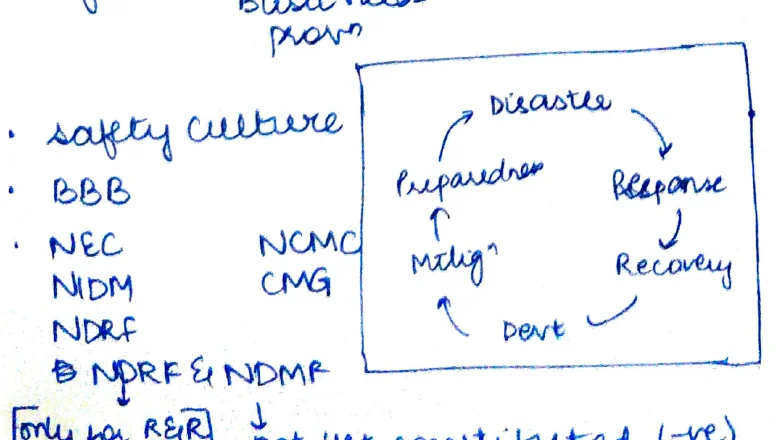
- Safety Culture
- BBB [Build Back Better]
- NEC [National Executive Committee] — NCMC [National Crisis Management Committee]
- NDMF [National Disaster Management Fund] — CMG [Crisis Management Group]
- NDRF [National Disaster Response Force]
- 8 NDRF & NDMF [note: 8 battalions of NDRF]
- [Only for R&R] — not yet constituted (−ve) [negative note]
Disaster Cycle (circular arrows):
- Preparedness → Disaster → Response → Recovery → Mitigation → Dev't [Development] → (back to Preparedness)
#PPPP for DM (Pyramid) + Joad [Joint] Response Comparison
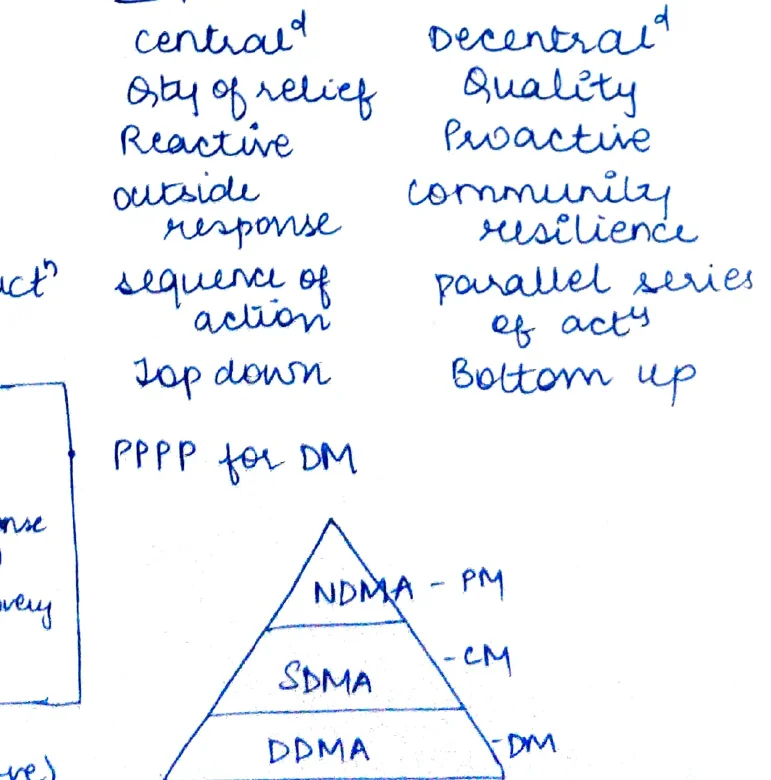
PPPP for DM pyramid:
- NDMA – PM [Prime Minister at apex]
- SDMA [State Disaster Management Authority] – CM [Chief Minister]
- DDMA [District Disaster Management Authority] – DM [District Magistrate at base]
Joad Response — Central vs Decentralised:
| Central | Decentralised |
|---|---|
| Stay of relief | Quality |
| Reactive | Proactive |
| Outside response | Community resilience |
| Sequence of action | Parallel series of acts |
| Top down | Bottom up |
#Page 2 — Sendai Framework, Causes, 3R→3P, Perception Management, Frameworks Convergence, NDMA Guidelines
#Opening Points
- "Every dollar spent on Mitig'n [Mitigation] — eg. Jirabs [Jiirabs? — illegible] in ANN survived Tsunami + NE [North East] houses on bamboo stilts saves X dollars on R&R [Relief & Rehabilitation]"
- Sendai – State has primary resp [responsibility] but other actors should share resp — circled (C) [important]
#Sendai Framework Targets (Wheel Diagram)
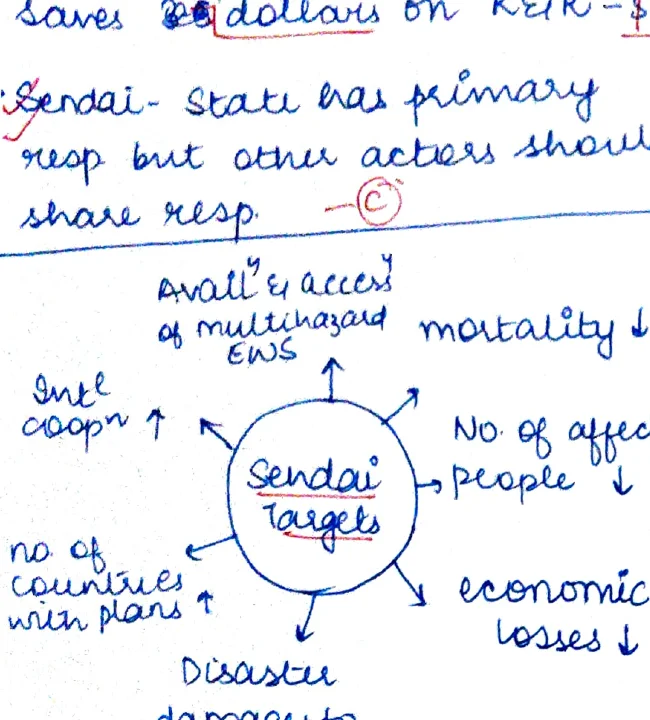
- Sendai Targets (7 spokes of the wheel):
- Availability & access of multi-hazard EWS [Early Warning Systems] ↑
- Mortality ↓
- No. of affected people ↓
- Economic losses ↓
- Disaster damage to CII [Critical Infrastructure and Industry] & basic services ↓
- No. of countries with plans ↑
- Int'l cooperation ↑ [International cooperation]
#Causes of Disasters
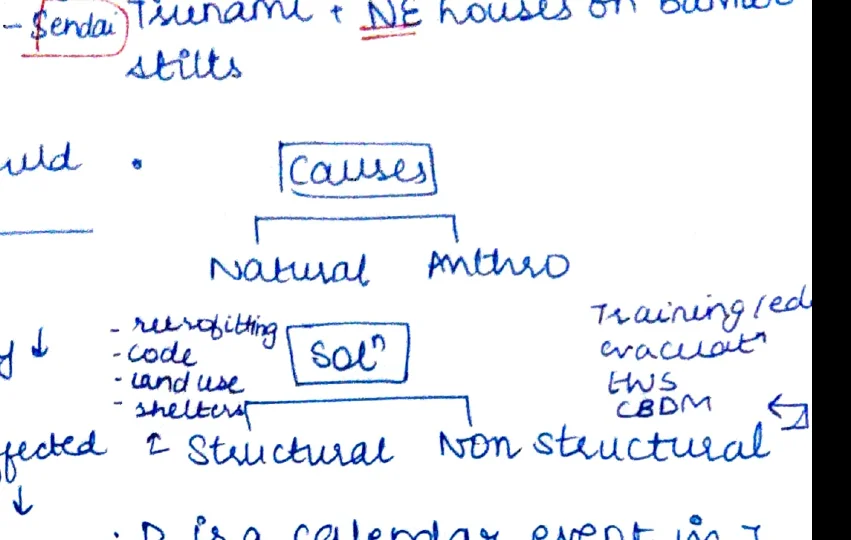
- Causes
- Natural
- Anthropo [Anthropogenic]
- Retrofitting
- Code [Building codes]
- Land use [planning]
- Shelters
- → SoL [Standard of Living / Structure of Life — box highlighted]
- 2 types of measures:
- Structural [physical infrastructure]
- Non Structural
- Training / education
- Evacuation [plans]
- EWS [Early Warning Systems]
- CBDM ← [arrow emphasis]
- D [Disaster] is a calendar event in I [India] [key statement]
#3R Approach → 3P Approach
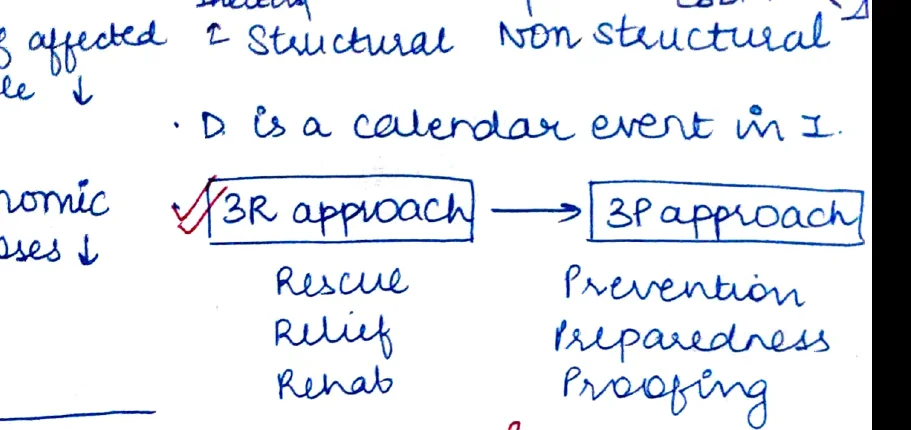
- 3R approach [old/reactive] → 3P approach [new/proactive]
- 3R: Rescue, Relief, Rehab [Rehabilitation]
- 3P: Prevention, Preparedness, Proofing [Disaster-proofing]
- CAG Report 2013 – termed Chennai floods as a man-made disaster
- First Resilience Kerala prog [programme] – Kerala + WB [World Bank] Int'l coop [cooperation] – circled
#Perception Management (DISASTER Acronym)
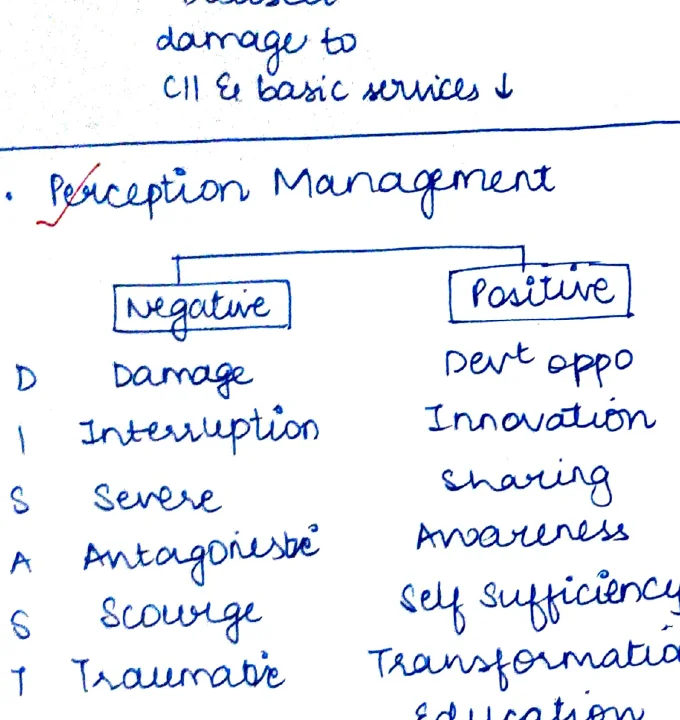
| Letter | Word | Negative | Positive |
|---|---|---|---|
| D | Damage | Damage | Dev't [Development] oppo [opportunity] |
| I | Interruption | Interruption | Innovation |
| S | Severe | Severe | Sharing awareness |
| A | Antagonise [Antagonistic] | Antagonise | Self sufficiency |
| S | Scourge | Scourge | Transformation |
| T | Traumatic | Traumatic | Education |
| E | Emergency | Emergency | Resilience |
| R | Risk | Risk | [illegible — cut off] |
#NDMA Guidelines
- Structural and Non-structural [two pillars of NDMA guidelines]
Observe NOW:
- IMS [Incident Management System]
- Monitoring
- [illegible — likely "Nuisance"/Guidance]
- EWS [Early Warning System]
- Zoning / Mapping [Zoning Mapping]
- Inter-agency coord [coordination]
- Awareness
- Mock drills
- Training & skill dev't [development]
- CBDM
#Economic Losses Due to Natural Disasters
- d [losses] = ~2% of GDP
- ~12% of CG [Central Government] Revenue [losses as share of CG revenue]
#Venn Diagram: Paris, Sendai, SDG, DRR Convergence
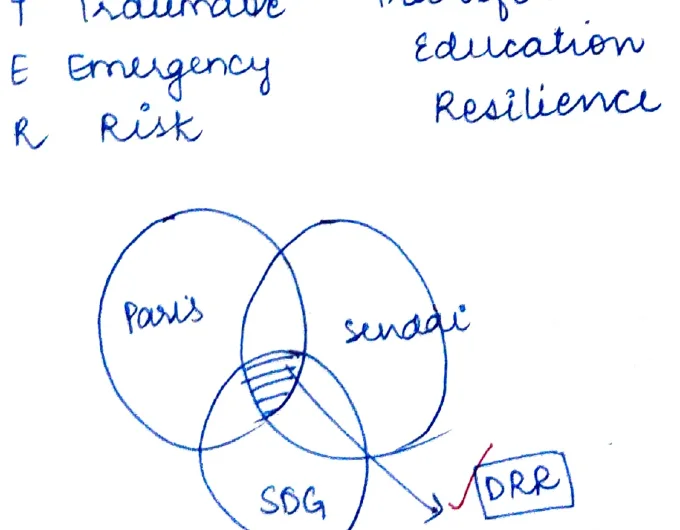
- Three overlapping circles: Paris (Climate) + Sendai (DRR) + SDG [Sustainable Development Goals]
- DRR [Disaster Risk Reduction] — where all three converge (checked/ticked)
- 3भजनांत्र / 3rd Shastri [अर्थशास्त्र — Arthashastra] – devoted a section to famine reduction measures [historical precedent]
#Page 3 — Cyclones, Cloudbursts, Floods, Droughts, Related Mechanisms
#Cyclones
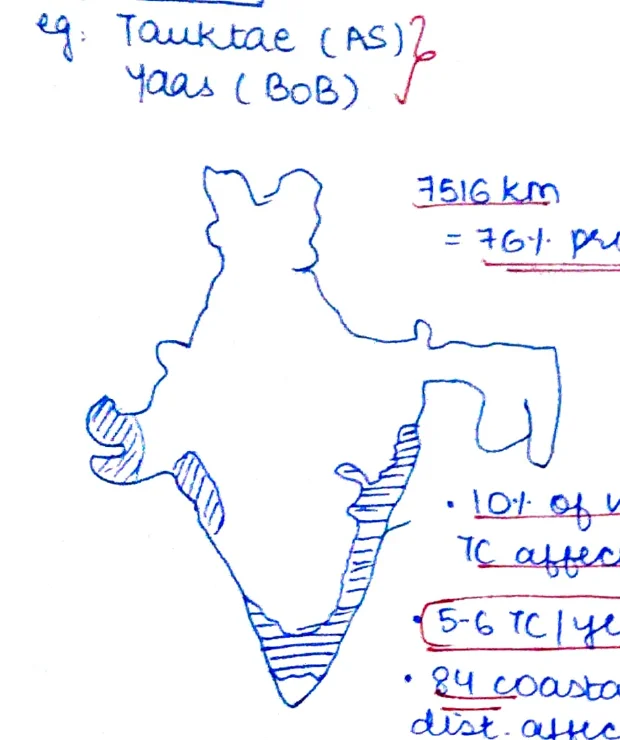
- eg. Tauktae (AS [Arabian Sea]) & Yaas (BoB [Bay of Bengal])
- 7516 km coastline = 761 prone [districts]
- 10% of India's TC [Tropical Cyclones] affected
- 5–6 TC/year [circled/highlighted — average frequency]
- 84 coastal districts affected
Institutional Mechanisms:
- NCRMP [National Cyclone Risk Mitigation Project]
- ICRZ [Integrated Coastal Zone Management]
- NbS → mangrove belt [Nature-based Solutions]
- SATARK – Odisha (BP [Best Practice]) – real-time alerts on diff [different] hazards (minimised casualties during cyclone Fani)
#Cloudburst
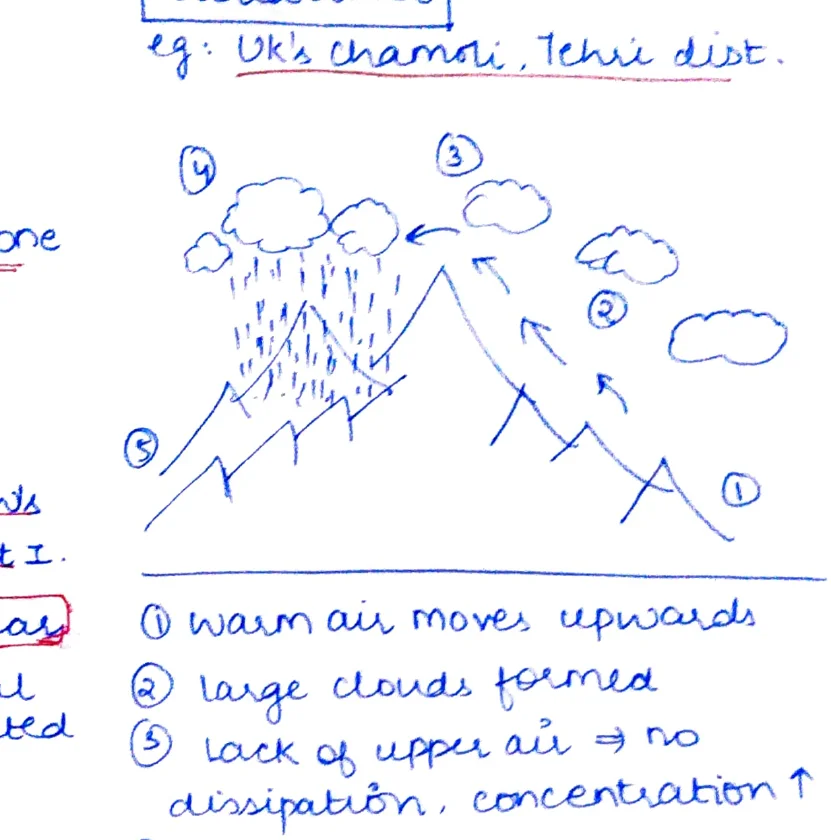
- eg. UK's [Uttarakhand's] Chamoli, Tehri district
- Process (numbered steps on diagram):
- Warm air moves upwards
- Large clouds formed
- Lack of upper air → no dissipation, concentration ↑
- Sudden, localised downpour
- Flash floods due to steep slope
- Why ↑? Dev't [Development] projects: CC [Climate Change], GW [Global Warming], concrete?, deforest? [deforestation]
- BP [Best Practice] → Copenhagen CAP [Cloudburst Action Plan — Copenhagen model]
#Floods [12:1 ratio box]
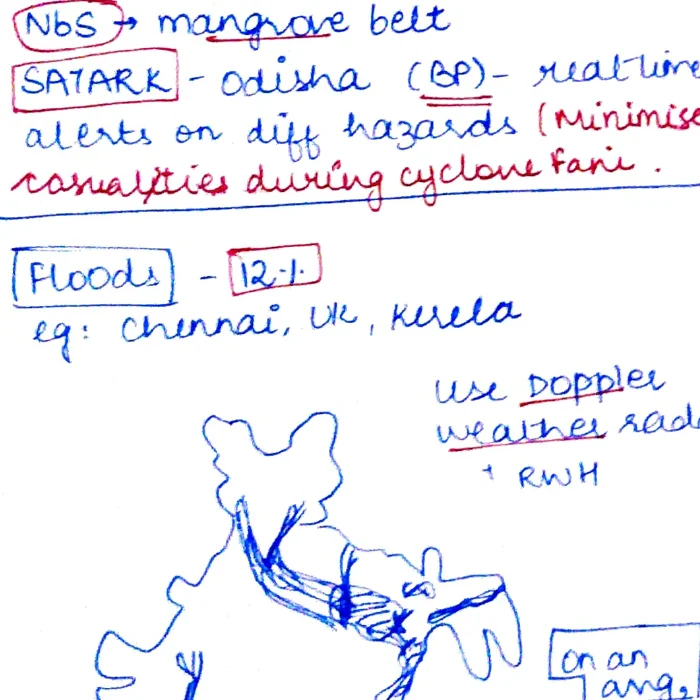
- Floods – [12:1] [damage-to-mitigation ratio or frequency ratio]
- eg. Chennai, UK [Uttarakhand], Kerala
- Use Doppler Weather Radar + RWH [Rainwater Harvesting]
- On an avg [average]:
- 75L ha [lakh hectares] land affected
- ₹1505 cr [crore] damage
- 1600 lives [lost per year on average]
Institutional Mechanisms:
- NITI – National Water Model (MIS/DSS [Management Information System / Decision Support System])
- Buoyant Building – Netherlands [model]
- Rain gardens / Sponge city [urban flood mitigation]
- IFLOWS – Mumbai, Chennai [Integrated Flood Warning System]
- Floodways, Manila [example]
- Aapda Mitra (train [trained] comm'l volunteers [community volunteers])
#Droughts
- L [Large] 681 area
- 1.5b [1.5 billion] affected so far
- Effect on GDP = ~2–5%
- Deccan region – most severe
- 80% rainfall in ≤100 days [concentration of rainfall]
- 811 area get ≤500 mm rainfall [low rainfall zones]
Mechanisms / Solutions:
- Cloud seeding – Toolbox by UNICF [UNICEF?] / Niti Aayog [Niti Water Budget]; State level Dist [District] Monitoring cells
- Jabalpur (Indore) – White [Whittle?] on property tax for RWH [Rainwater Harvesting]
- [Talviki Shivas? — illegible], MH [Maharashtra] – model
- NFP [National Forest Policy?] village – straight rice + go [?] [illegible end of line]
#Page 4 — Landslides, Seismic Zones, Forest Fires, Tsunami, International Frameworks, RESILIENT India
#Landslides
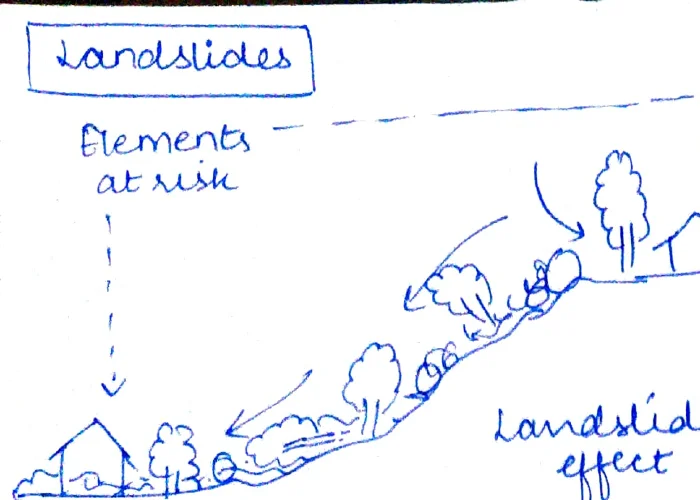
- Elements at risk (from landslide): houses, trees, infrastructure
- Landslide effect → debris flow damages elements at base of slope
Statistics:
- MST [Most / Highest] land area
- 30% of WLS [World's Landslides (circled)] in Him [Himalayan] region
- Avg 2 (circled) per sq km in Sikkim & Garhwal regions
Geo Notes / Eq [Earthquake] linkages:
- CDRI, SGD9 [CDRI — Coalition for Disaster Resilient Infrastructure; SDG 9] (& others)
- Zero casualty approach [target]
- Disaster Proof cities
- Catastrophe bonds (SL [Sri Lanka?]) [financial instrument]
#India Seismic Zone Map
![India seismic zones map — Delhi (Zone IV), Himalayas (Zone V), Western Ghats (Zone II/III), with annotations; Ekra [Ekra?] construction of bamboo in Assam; Bhangai in Kutch](assets/img/disaster_management_p4_02.webp)
- Eq [Earthquake] — India Seismic Zones:
- Zone V – Himalayas (highest risk)
- Zone IV – Delhi
- Zone III – [central belt]
- Zone II / III – Western Ghats
- Ekra construction of bamboo in Assam [traditional earthquake-resistant construction]
- Bhangai [Bhungas] in Kutch [Kutch, Gujarat] [traditional circular mud huts — earthquake resilient]
- 811 prone as per FSI [Forest Survey of India] [cross-reference]
#Way Forward: RESILIENT India (Acronym)
- R – Risk coverage for all
- E – Enhance local capacity
- S – Social media & ICT
- I – Imbibe [Imbue] DRR | BBB [Disaster Risk Reduction / Build Back Better]
- L – Leadership of community
- I – Int'l collab [International collaboration]
- E – Enhance coop [cooperation] / coord [coordination]
- N – Networking approach
- T – Tech [Technology] to be leveraged
eg. UNESCO–IOC [Intergovernmental Oceanographic Commission] recognised 3 communities of Odisha as "Tsunami Ready" — circled [important example]
-
Venkataraipur
-
Noliasahi
-
Folk troops in UP [Uttar Pradesh] for awareness community part [partnership] in Merigaon, Assam
#Forest Fires
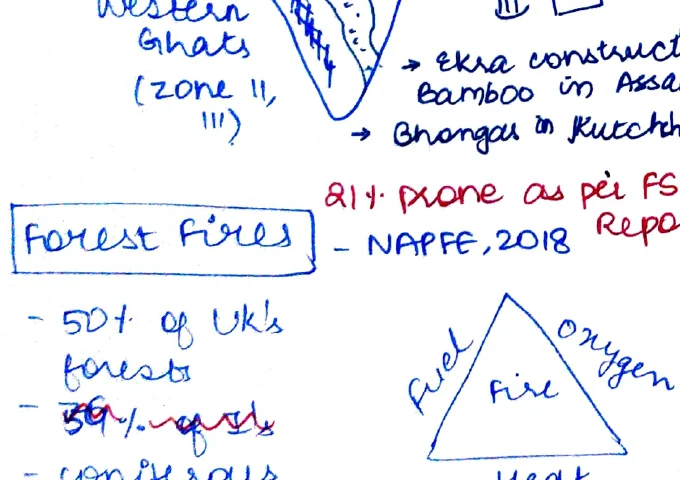
- 50%+ of UK's [Uttarakhand's] forests
- 59% – grass / shrub [fire-prone type]
- Coniferous (pitchpine) – very prone
- Fire Triangle: Fuel + Oxygen + Heat → Fire
- 211 prone as per FSI [Forest Survey of India]
- NAFFE 2018 Report [National Action Plan on Forest Fires]
#Tsunami
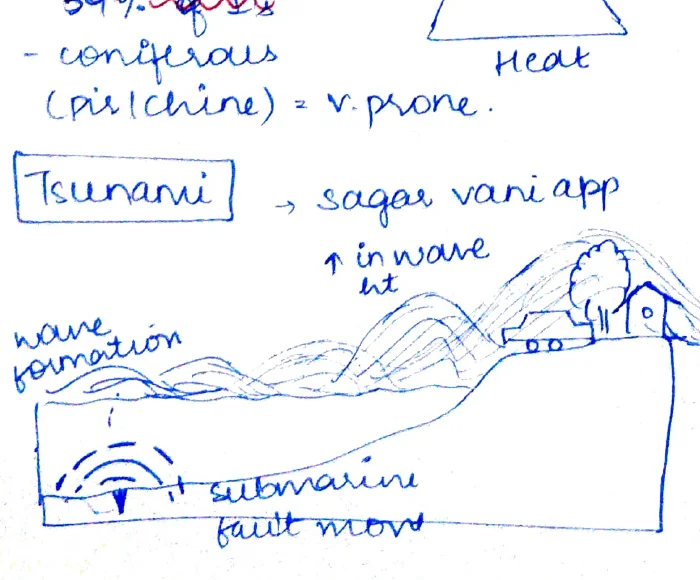
- Sagar Vani app [mobile app for sea/ocean alerts]
- ↑ in wave height [waves grow taller as they approach shore — shoaling effect]
- Wave formation → submarine fault movement [trigger mechanism]
#International DRR Frameworks: Yokohama → Hyogo → Sendai
![Framework evolution flow: Yokohama (1994) → Hyogo (2005–15) → Sendai (2015–30); Yokohama focus: Relief; Hyogo focus: M, E, P [Mitigation, Education, Preparedness]; Sendai focus: DRR](assets/img/disaster_management_p4_05.webp)
- Yokohama (1994) → focus: Relief
- Hyogo (2005–15) → focus: M [Mitigation] E [Education/Enablement] P [Preparedness]
- Sendai (2015–30) → focus: DRR [Disaster Risk Reduction]
- Community part [partnership] in Merigaon, Assam [example]
#Hazard + Vulnerable Population = Disaster (Venn Diagram)
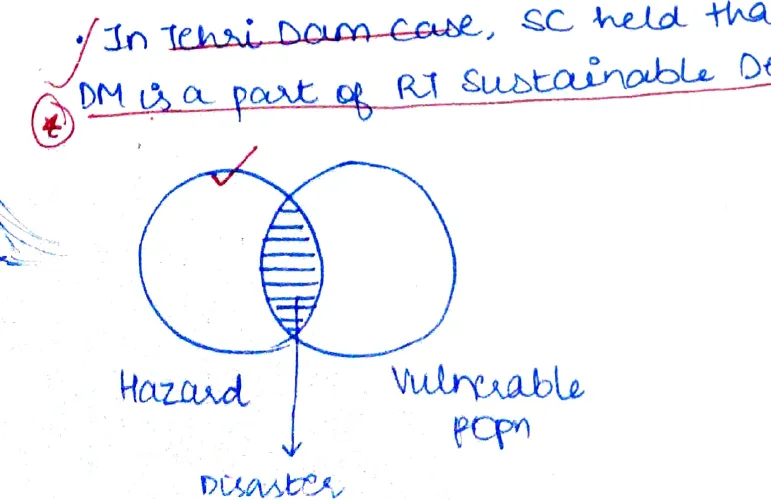
- Hazard ∩ Vulnerable pop'n [population] = Disaster [intersection of the two circles]
- In Tehri Dam case, SC [Supreme Court] held that DM [Disaster Management] is a part of R [Right] to Sustainable Dev [Development] — circled [constitutional/judicial precedent, very important]
#Summary Tables
#Key Acts / Bodies
| Body/Act | Year | Note |
|---|---|---|
| NDMA | 2006 | National Disaster Management Authority |
| NDPM [NDMP] | 2009 | National DM Policy |
| NDMP | 2016 | National DM Plan |
| NDRF | — | 8 battalions; only for R&R |
| SATARK | — | Odisha best practice for cyclone alerts |
| NAFFE | 2018 | National Action Plan on Forest Fires |
#International Frameworks
| Framework | Year | Focus |
|---|---|---|
| Yokohama | 1994 | Relief |
| Hyogo | 2005–15 | Mitigation, Education, Preparedness |
| Sendai | 2015–30 | DRR (Disaster Risk Reduction) |
#Sendai Targets (7 Global Targets — 2015–30)
- Reduce global disaster mortality
- Reduce no. of affected people
- Reduce direct economic losses relative to GDP
- Reduce disaster damage to CII [critical infrastructure] & basic services
- Increase no. of countries with national/local DRR strategies
- Enhance international cooperation
- Increase availability & access to multi-hazard EWS
#Phases of DM
| Pre | During | Post |
|---|---|---|
| Preparedness | Evacuation | Recovery |
| Prevention | Search & Rescue | Rehab |
| Mitigation | Basic needs provision | Reconstruction |
#3R → 3P Shift
| 3R (Old/Reactive) | 3P (New/Proactive) |
|---|---|
| Rescue | Prevention |
| Relief | Preparedness |
| Rehabilitation | Proofing / Disaster-proofing |
#India Vulnerability Statistics
| Hazard | % Vulnerable |
|---|---|
| Seismicity (earthquake) | 58% |
| Drought | 68% |
| Cyclone | 8% (76% of coastline) |
| Floods | 18% |
| Overall (single or multiple) | 85%+ |
Internal Security
Topper handwritten notes#Page 1 — LWE (Left Wing Extremism), Threats Overview, Red Corridor
#Threats: Internal vs External

- Threats categorised into two overlapping circles:
- Internal threats
- External threats
- Overlap zone = threats that are both internal and external in nature
#Issues — NCC DITCH (mnemonic)
- N — [illegible/abbreviation]
- C — Corruption
- C — [illegible]
- D — Disputes
- I — Identity
- T — Terrorism
- C — Communalism
- H — [illegible]
#Red Corridor
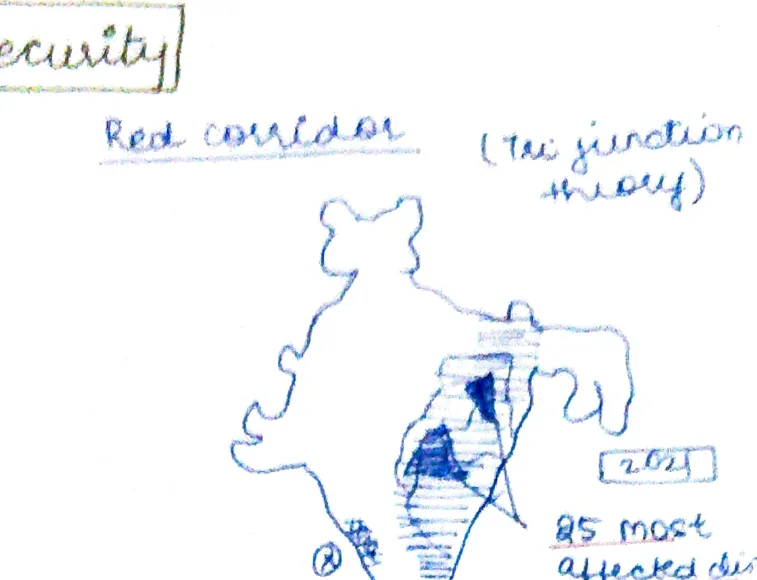
- Red Corridor = (Tri-junction theory)
- Map shows affected states in eastern/central India
- 2021: 85 most affected districts → 70 total (reduced)
#LWE Evolution in India — Three Stages
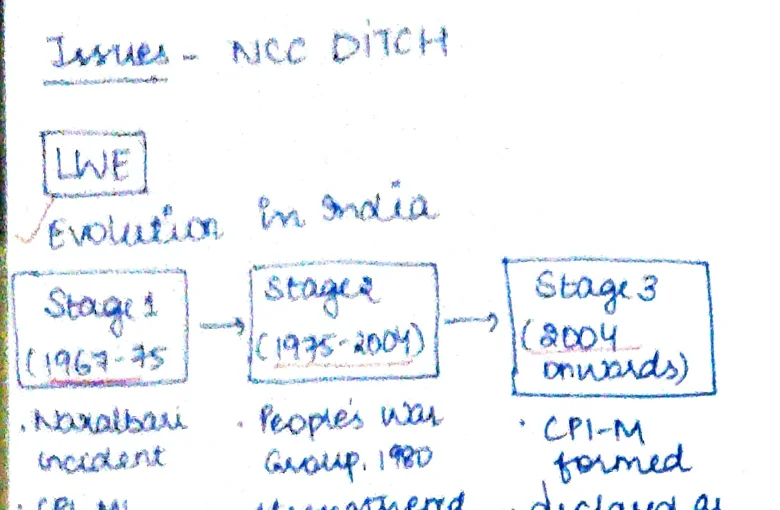
- Stage 1 (1967–75)
- Naxalbari incident
- CPI-ML formed
- Stage 2 (1975–2004)
- People's War Group (PWG) & MCC formed and strengthened in Bihar
- Stage 3 (2004–onwards)
- CPI-M formed
- Declared as banned org in 2009
Sub-themes under LWE
- Jai Jangal Zameen movement
- Dev Deficit (development deficit)
- Social Exclusion
- Link between deprivation and LWE
- 6 mukhuyas [six key demands/leaders] (Schemes → SRE [Security Related Expenditure], Roshni, SIS [Special Infrastructure Scheme], 11th Five Year Plan docs), Road Req[uirement] Plan
#Bell Curve of Insurgency + LWE Fatalities
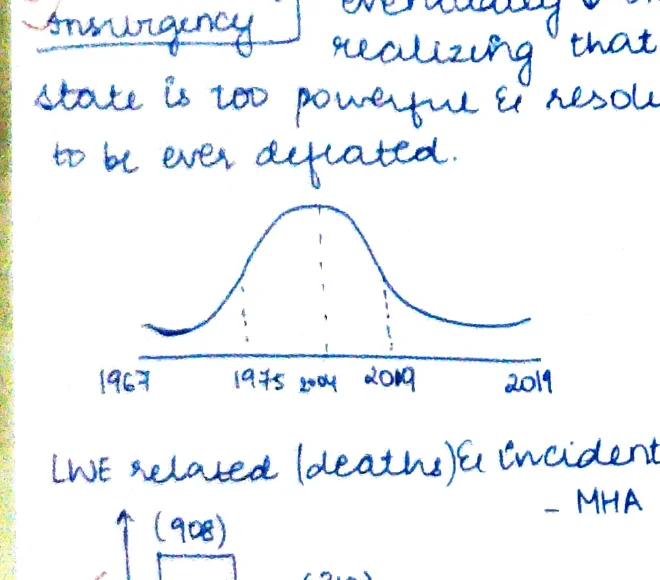
- Bell curve of insurgency:
- Initial rise but will eventually go on realising that state is too powerful to be defeated
- States are too powerful to absolutely [defeat insurgencies]
- LWE Related Deaths/Fatalities — MHA data:
- Bar chart showing decline:
- ~408 (2009)
- 310 (2011)
- 288 (2012)
- 183 (2014)
- 665 (2020/2021 — spike)
- Trend: overall decline with occasional spikes
- Bar chart showing decline:
- Notable incidents:
- eg: Gadchiroli land mine blast, 2019 → killed 15 policemen
- Issues: neglect of SOP, leadership of IAS, obligation of MHA, guerrilla warfare of LWE, intelligence tech, funds laundering
#Multi-Pronged Strategy (against LWE)
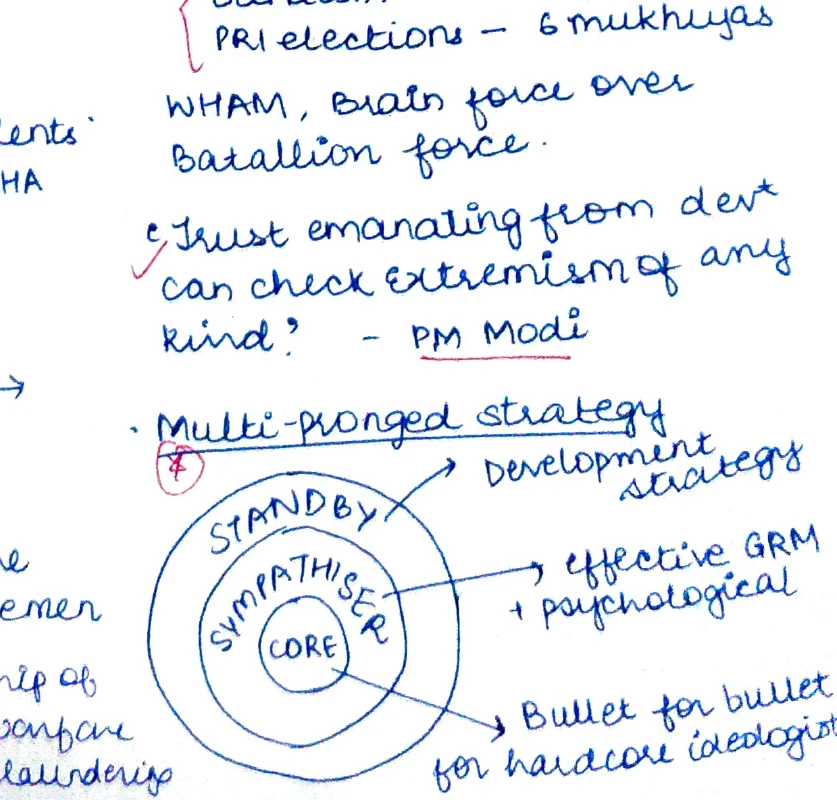
- Schemes → SRE, Roshni, SIS (11th FYP docs), Road Req[uirement] Plan
- Agencies:
- Greyhounds — AP
- Sandesh Bihar → pact in PRI elections — 6 mukhuyas [priorities]
- WHAM [Winning Hearts And Minds], Brain force over battalion force
- "Trust emanating from dev[elopment] can check extremism of any kind." — PM Modi
- Multi-pronged strategy diagram (concentric circles):
- Core: STANDBY CORE [development]
- Ring 1: Effective SRM (Security-Related Measures)
- Ring 2: psychological [approach]
- Outer: Bullet for bullet for hardcore [cadres]
#Page 2 — North East India, J&K, Counter Insurgency Strategy
#North East
- 8% area, 4% population of India
- Land surplus, resource rich
- BUT governance deficit
- 5800 km border with 5 countries
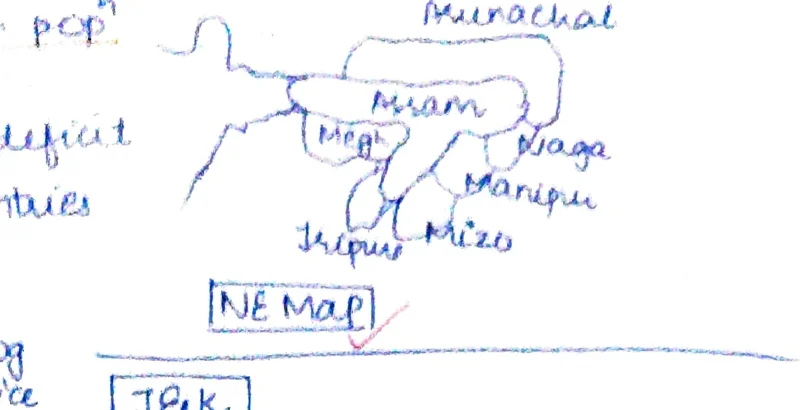
- NE Map shows: Mizoram, Assam, Nagaland, Meghalaya, Tripura, Manipur, Arunachal Pradesh
Reasons → HIDE PALM GG (mnemonic)
- H — History
- I — [illegible]
- D — Drugs
- E — Ethnicity
- P — Pol[itical]
- A — Appsa [Aspirations?]
- L — Leadership
- M — Migration
- G — Greed
- G — [illegible]
Initiatives (for NE)
- BADR, NITI NE Forum, HADP [Holistic Agriculture Development Programme], MDONER [Ministry of Development of NE Region], NE BIZ Summit
- G7SCH, NESIDS, NE RLP, NE Industrial Innovation & Promotion Policy 2007, 10 Point Plan
- Budget earmarked
- KMT, BCIM, IMT (30 lWT [lakh workers?])
- Operation Sunrise (Myanmar)
- SC in Sonowal case held that illegal migration is an act of aggression
Types of Migrants
- Both Mixed & Mass type:
- Refugees → Job seekers → Anti-social → Suicidal → humanitarian
- Beze-Barian [Bezbaruan?] Committee for NE
#J&K
- "Kashmir can be won not by power of sword but by power of appeal [love]" — Kalhana, Rajatarangini (circled as important quote)
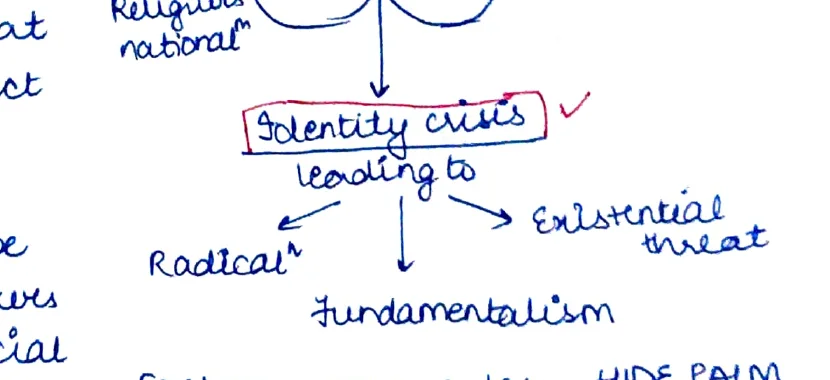
- J&K Venn (3 circles):
- Pak's religious national [identity]
- India's secular rational [identity]
- Kashmiriyat — intersection of both
- Identity crisis leading to:
- Radicalism
- Fundamentalism
- Existential threat
Factors → More or less HIDE PALM
- Initiatives: UDAAN, PM Dev[elopment] Package, Project Himayat, Sadbhavana Yojana, Nai Rozgar Scheme, SEHAT Policy
#Counter Insurgency Strategy
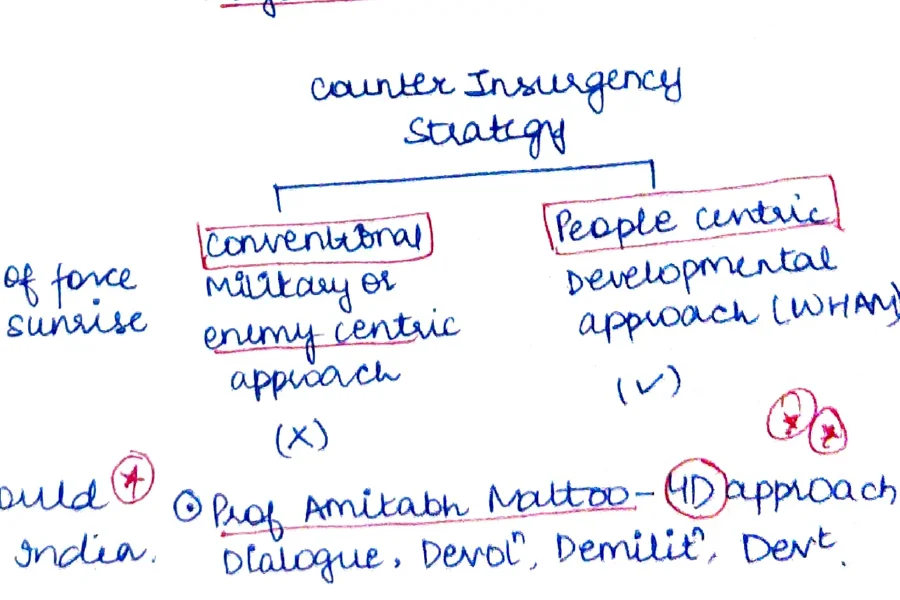
- Two approaches:
- Conventional / Military or enemy-centric approach (X) [not preferred]
- People-Centric / Developmental approach (WHAM) (✓) [preferred]
- "Road to New India should run through North East India"
#Tribal Strategy (NE)
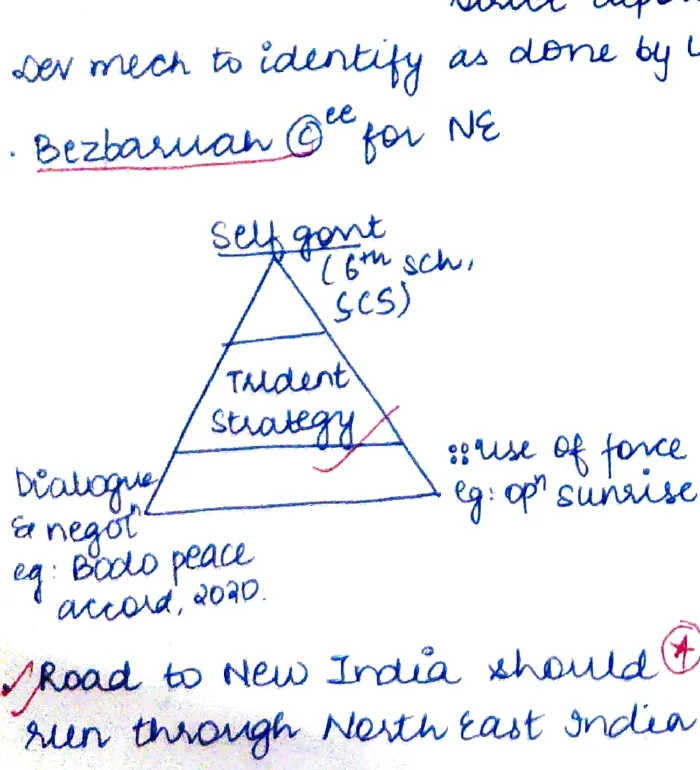
-
Triangle diagram:
- Top: [Government]
- Left: 7th Schedule (SCS) — Tribal people
- Right: Rule of law / sunrise [commerce?]
- Bottom: Risk of fence [ing?]
- Centre: Tribal strategy
-
Approach:
- Forms a game → alles [allies?] status quo to overthrow govt
- Non-violent eco obj — invisible
- Violent pol obj — visible → take resp of attack
- 3d> (3-dimensional approach)
- Lone wolf also
- OC are structured hierarchically so difficult to get on top
-
Bodo peace accord 2020
-
"Conflict is: forms a game → alles status quo to overthrow govt"
- Non-violent eco obj [invisible]
- Violent pol obj: visible → take resp of attack
- 3d>: lone wolf also
-
Blog: Amitabh Mattoo — 4D Approach: Dialogue, Devol [Devolution], Demility [Demilitarisation], Devt [Development]
#Page 3 — Terrorism, External Actors, Use of Technology
#Kashmir/Afghanistan/FATA Map
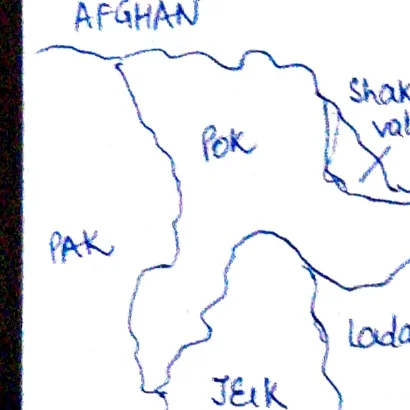
- Map shows: AFGHAN, CHINA, Pak, J&K, Ladakh, Shaksgam Valley, Aksai Chin, (Tibet), Siachen
- Red Corridor shown with hatching
#Terrorism — Definition
- Terrorism = Systematic use of violence to achieve political/religious/ideological purpose
- Lowest fatalities in 2019 — 681
LWE Fatalities Bar Chart
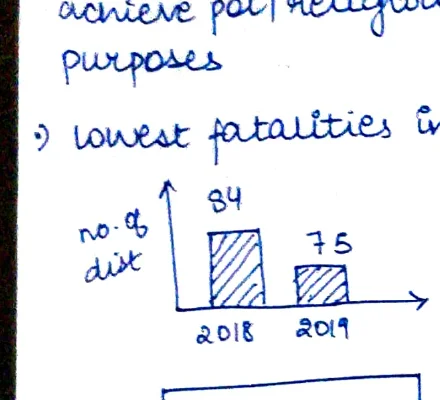
- Bar chart:
- 2018: 94 deaths
- 2019: 75 deaths (reduced)
- Violence graph: ahead [trend line going down]
#Issues — ABCDE Framework (for Terrorism)
- A — tech fatigue
- B — eroding final system [erosion of rule of law]
- C — Money laundering
- D — Crime-pol [political] nexus
- E — Low HR [Human Resources]
- + Corruption
- + Implement deficit
Steps to counter terrorism
- Mountain Bangladesh on FICN [Fake Indian Currency Notes], FATF listing, TFFC [Terror Financing and Financial Crimes] cell banning crypto to devices?
- Initiatives / Institutional
#Key Legislation & Institutions
- MAC [Multi Agency Centre], NATGRID, NIA, UAPA 1967 (amended)
- Christchurch Call to Action
- Global Internet Forum to Counter Terrorism (GIFCT) — 2017 by [Facebook/Meta]
- Global Counter (Terrorism) Forum — 8 [member countries]
- Tagma process → UN
- Nogata process → UN
#Use of Technology BY Terrorists
- Propaganda
- Recruit & Radicalise
- Financing
- Training
- Plan / coord / executing
- Cyber Radicalism
#Use of Technology TO Counter Terrorism
- Intelligence gathering
- Surveillance
- Counter narrative
- Intl coop [International cooperation]
- Christchurch Call → [tech] govt [collaboration]
#External & Non-State Actors Diagram
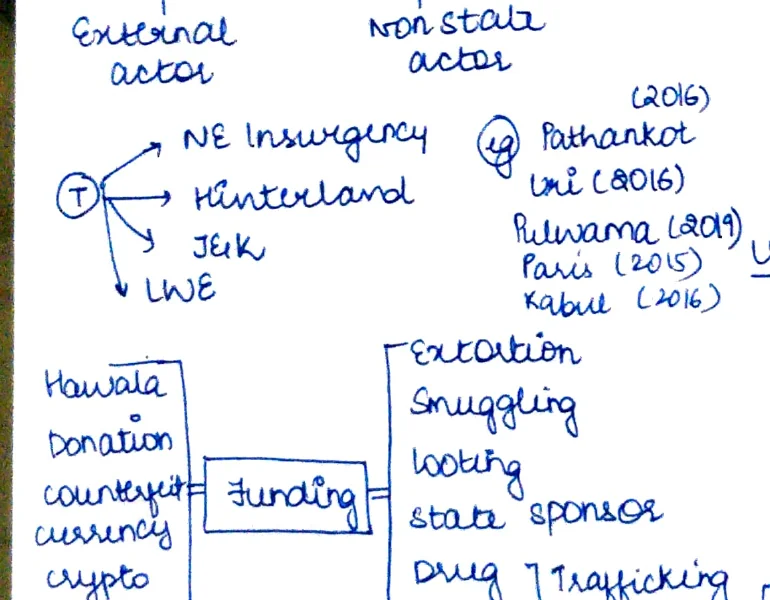
- External actors (2016):
- JeM [Jaish-e-Mohammed] (2016)
- Hizbul (ML [Mujahideen]) (2016)
- Raniya (2016)
- Farsi (2016)
- Kasid (2016)
- Non-state actors:
- Dahankar (IM [Indian Mujahideen]) (2016)
- Ranyana [?] Farsi (2016)
- Linkages → Hawala, Donation, Counterfeit, Crypto, Illegal training
- Activities → Extortion, Smuggling, Looting, State sponsor, Drug trafficking, Human [trafficking]
#CCIT — Proposed by India in 1986 (UNGA)
- Universal def[inition]
- Criminalise for [terrorism]
- Legal oblig[ation]
- CBT [Capacity Building for Counter-Terrorism] as extraditable offence
- BRIC Counter, Tracker strategy
- SCO-RATS
#Challenges Faced by India in Countering Terrorism
- Geog[raphy] of India
- Hostile neighbours
- "Best way to prevent is to prepare" [circled]
#Page 4 — Organised Crime (OC), OC–Terrorism Nexus, Cybersecurity
#Organised Crime (OC) — Definition
- As per UNTOC → 3 or more persons form a group to obtain some material benefit through illegal act
- Global problem → global response → collaborative approach
#OC–Terrorism Nexus
- On 3 levels — co-existence / cooperation / convergence
- Common enemy = State
Financing Links (OC → Terrorism):
- Financing → eg: extortion in NE
- Narco [drug trafficking linkages]
- Funding through ML [Money Laundering]
- Human trafficking etc → Boko Haram
- eg: Bombay blast (1993) & D Company
#OC–Terrorism Nexus Diagrams
- Triple Venn (overlapping circles):
- Drug (top-left)
- Terror (top-right)
- Human trade (bottom)
- Convergence at centre
- Note: "No RISHE [risk?]" at bottom / "Convergence"
- Flowchart (becomes more terrorist):
- OC → Alliance with terror org
- → Use of [terror] tactics for operational purposes
- → BLACK HOLE SYNDROME
- → Criminal activity for [revenue] financing
- → Alliance with criminal org
- → Terrorists (bottom)
#OC Characteristics
- Forms a game: alles [allies] status quo to overthrow govt
- Non-violent eco obj — invisible
- Violent pol obj — visible → take resp of attack
- 3d> lone wolf also
- OC are structured hierarchically so difficult to get on top
#Drug/Terror/Human trafficking — No RISHE / Convergence
- Two circles: Drugs + Terror / Human trade → convergence at centre
#Cybersecurity — Layered Defence
- Layered defence (like concentric arches/rainbow):
- Outer: Firewalls, air gapping, demilitarised zones, to mgmt
- Next: Antivirus patching
- Next: Network Applications File & Data
- Inner rings: secure coding, encrypt, rights mgmt
- Cybersecurity = layered defence
#Page 5 — Money Laundering, Technology & National Security, Social Media, Black Money
#Money Laundering
- Definition: Making illegal money look legitimate
- Three stages:
| Stage | Description |
|---|---|
| Placement | Introducing illegal money into financial system |
| Layering | Complex transactions to hide trail |
| Integration | Bringing laundered money back as apparently legitimate |
Techniques
- Hawala, 3rd party cheques
- Photos, casinos, cybercrime
- Hedge funds, cryptocurrency
- Structuring deposits (small deposits in many a/cs), shell co[mpanies]
Key Fact
- ML = 2–5% of World GDP is laundered annually
3F → Response:
- Freezing
- Confiscation [Freezing]
- Forfeiting
Statutory / Bilateral / International Framework
| Level | Instrument |
|---|---|
| Statutory | PMLA 2002, FEMA 1999, NDPSA 1985 |
| Bilateral | ED, FIU |
| International | FATF, Vienna Conv[ention], Basel Eff[ective Measures], Egmont Group, IOSCO |
#Technology & National Security
Facilitators
- Evidence collect[ion]
- Intelligence gathering
- Surveillance — drones / radar
- Reconnaissance
- Collab — NATGRID
- Nano tech — camera / sensor / micro weapons
- AI — computation, robots in Siachen
Challenges
- Cyber crimes
- Piracy
- ToC [Transnational Organised Crime] — dark web
- Crypto & terror finance
- Radical [content online]
- 3D printed guns
- Hybrid warfare
#Social Media
| +ve | -ve |
|---|---|
| Ease of comm[unication] / awareness | Fake news |
| Actionable input | Privacy breach |
| L&O [Law & Order] maintenance | Polar[isation] |
| Online FIR | Radical content |
| Intelligence & surveillance | Cyber bullying |
| — | Insurance [Internet] fraud |
| — | Comm[unity] outreach [misuse] |
Examples (negative):
- NZ terror attack — live on Facebook (c41 [case?])
- Rumours of child kidnapping → mob lynching in Jharkhand
- Morphed videos → riots in Muzaffarnagar, 2013
Policy Response
- Natl Social Media policy
- Digital literacy
#Black Money
- If money breaks land in its origin/move/use & is not reported for tax purposes
- From mines/corruption/biz
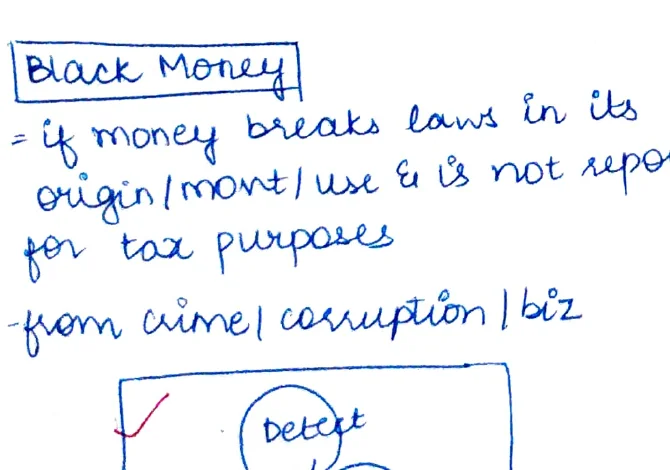
- Venn: Detect / BM [Black Money] / Prevent → Respond [at intersection]
- Lack of:
- Challenges — tech (AI/Big data), HR, tax evasion, smuggling, global I [intelligence] efforts, enforcement agencies coordination
#Page 6 — Cybersecurity (Detailed), Cyber Crime, Budapest Convention
#Cyber Security — Definition
-
Acc to ITACT 8000 — protecting info/equipment/device from unauthorised access/use/modify/destroy
-
Cybercrime against women → Cyber stalking, Defamation, Morphing pics, Pornography
-
Cyby [Cyber] crimes (NCRB) = #10
-
Cyber warfare = when state uses internet-based [invisible] force to sabotage or espionage [against] another
Diff from Traditional war:
- Independent theatre of war
- Borderless
- Contactless
- Ease of location
- Multidimensional impact
- Disguised attack
Examples:
- Estonia (2007), Georgia (2003)
- CERT-In cyber attack by [countries] → [illegible]
- Kudankulam plant — 269 [attacked]
- UBI Helst [?]
- Data theft at Zomato (2013)
- wannacry → region stacker → social media ac → Mumbai hack → Pakistan
- SCI & SH [?]
#Meera Hemachandra — Cybercrime Statistics
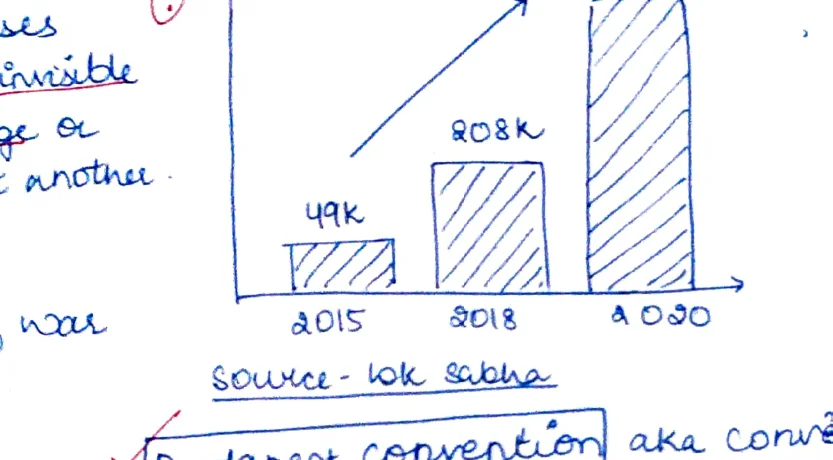
- Bar chart (NCRB cybercrime cases):
- 2015: ~49K
- 2018: ~808K [?]
- 2019: ~1158K [?] — Source: 10K Sikha [?]
- Steep upward trend
#Pol Gapping — Isolate CII from Internet
Challenges:
- Data colon [control?]
- Import dependency & 4.0 architecture [in local infra]
- HR
- Digital illiteracy
- Under reporting
- 4.0 coord [co-ordination]
#Budapest Convention
- Aka Convention of Council of Europe — only binding instrument — UK & US are members
- India not signed:
- Disputes with ~90 countries
- Mutual Legal Assistance Treaties (MLATs)
- In conflict: it allows access to investigate [company?]
- Some provisions: override IT Copyright Act
- Framed in 2001 — new and so new law is needed
#Cybersecurity Legal Framework
| Level | Instrument |
|---|---|
| Legal | IT Act, NCS policy (2013), Natl DIG comm, Policy (2018), ESIM policy |
| Bilateral | CERT-In (Natl [National?]), NCCC, Cyber Kendra |
| International | Budapest Convention, India–US Cyber Partnership Plan (2011??) |
- Cyber & ACT Combo org in India in 2017 → Cyber Diplomacy
- US-India Cyber Kinship Plan
#US Dept of Defence — 4 Stages of Cyber Attack
- Reconnaissance → Attack → Expansion → Obfuscation [Exfiltration?]
#Page 7 — Security Challenges (Mind Map), Coastal Security, Border Security
#Security Challenges — Mind Map
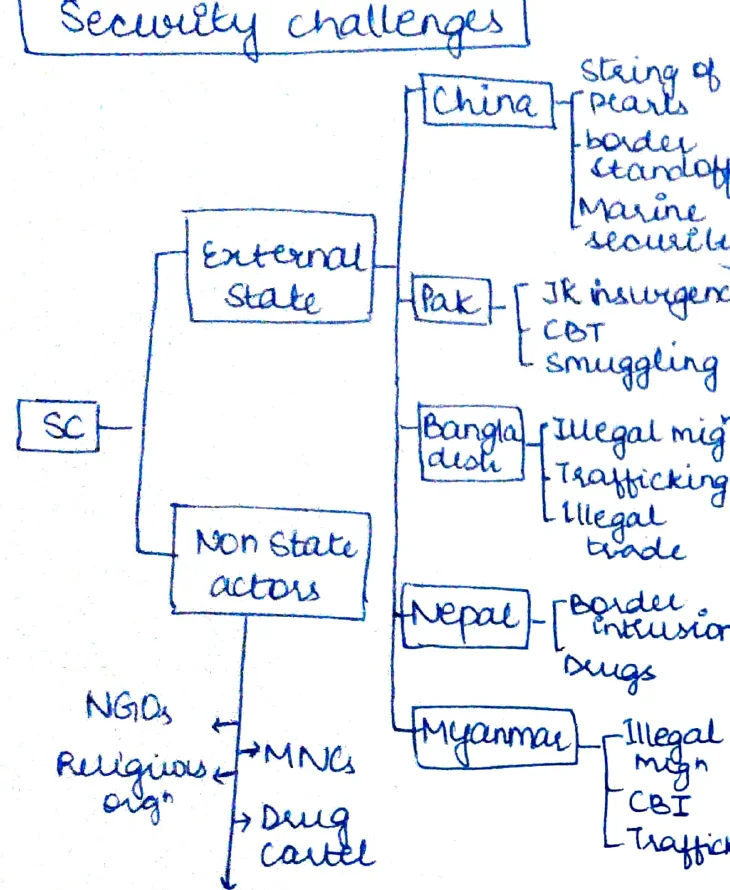
- SC [Security Challenges]:
- External State actors:
- China: String of pearls, border standoff, [illegible] Marine security
- Pak: JK insurgency, CBT [Cross Border Terrorism], smuggling
- Bangladesh: Illegal migration, trafficking, illegal cattle [trade]
- Nepal: Border intrusion, drugs
- Myanmar: Illegal migration, trafficking [Drug trafficking through Golden Triangle?]
- Non-State actors:
- NGOs, Religious orgs
- MNCs
- Drug cartels
- Armed groups: Al Qaeda, ISIS, IM, MAOIST
- LWE, Internal, JK&E (J&K extremism), Hinterland
- LOC
- External State actors:
Security challenges — Golden Triangle (drug routes)
- Drug routes: Golden Triangle area (Myanmar/Thailand/Laos)
- Coastal Terrorism — via piracy
- Drugs → Golden [?]
- Illegal migration
- Cattle [trade]
- Insurgency
#Coastal Security — 3-Layered
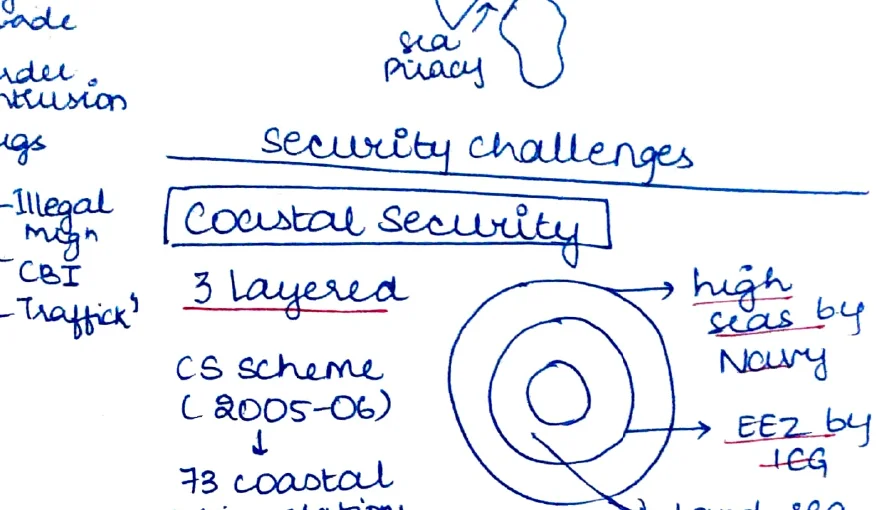
- 3 Layers:
- High seas — by Navy
- EEZ [Exclusive Economic Zone] by [Coast Guard]
- Land–sea interface — by Coastal Police
- CS Scheme (2005–06)
- 73 coastal police stations
Need for PTT CID:
- Pop[ulation] — VS + 3 metro cities
- Terror (2008) [26/11 Mumbai attacks reference]
- Trade
- China factor
- Infra safety
- Disputes (sir creek)
#Border Security — India Map
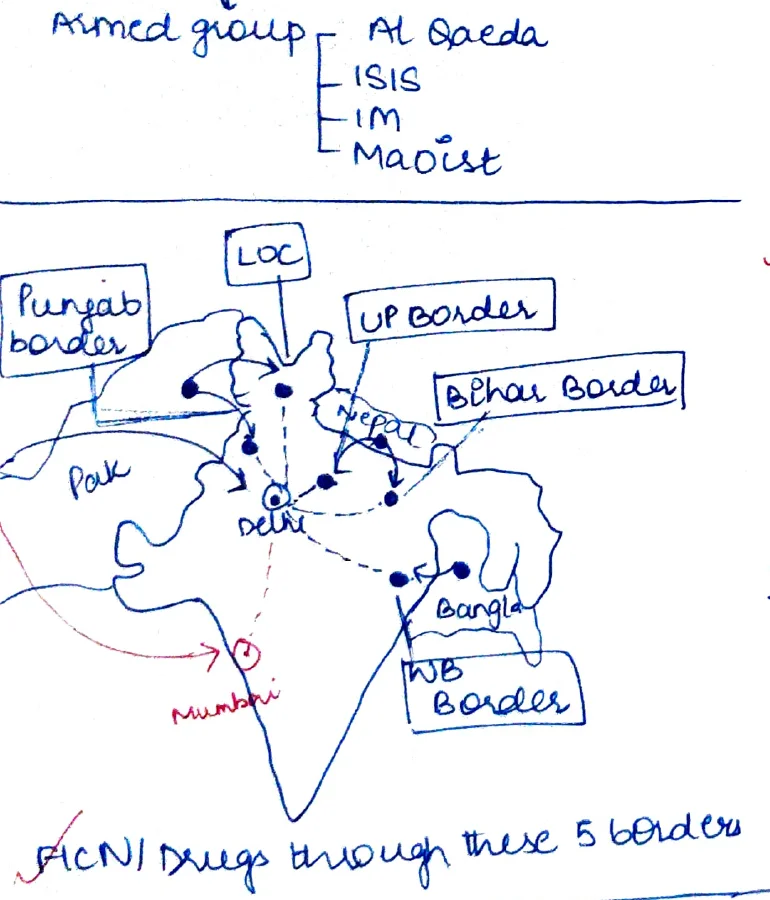
- Map shows: Punjab borders, LOC, UP Border, Bihar Border, Delhi (central), Pak (left), Bangla[desh], WB [West Bengal] Borders
- FICN/Drugs through these 5 borders
- Bodo peace accord 2020 [noted]
- Road to New India should run through North East India
#Initiatives (Coastal Security)
- Ex like Sea Vigil
- Sagar Kavach (boxed)
- Sagar Prahari Bal (boxed)
- Sagar Suraksha Dal (Information Bal)
- Integrated by fishermen: I-cards [identity cards for fishermen]
- CSS (2005) [Coastal Security Scheme]
- IMAC (boxed), IFC-IOR [Information Fusion Centre — Indian Ocean Region]
- JOC on AAN [?] + Maritime Theatre Command
- Upgrade infra + procedures
- Inst[itutionalise] AS mgmt [Automatic Station management]
- Regulate drones
- Air traffic control
- Weapon system & interceptors
- Air Defence Identif[ication] Zones (ADIZ)
#Air Security
- Air sov[ereignty] by Paris Convention (1919) + ICAO + Chicago Convention
- eg: Purulia armsdrop case
- Flexible use of airspace
#Page 8 — Border Issues (Detailed — Bangladesh, Nepal, Bhutan, Pakistan, China, Myanmar)
#Border Issues — 15000 kms total
Bangladesh — 4096 km (by Radcliffe [line])
- Illegal migration
- Cattle smuggling (₹1000 cr revenue loss) & other essential items
- eg: Sandesh Sunder [?]
- FICN
- Human & narcotics
- Kidnapping & thefts
- Water disputes
- Integrated check posts, fencing & floodlighting border/trade, border outposts, LBA 2015, 2016 bound crime free stretch
Nepal — ~1751 km
- Forceful grabbing of land
- Open borders exploited by terrorists & escape of criminals
- Smuggling → FICN
- Gun running
- Human [trafficking]
- Maoist support
- Bodo-Biku Border Coord. Centre → Intelligence section to SSB
Bhutan — ~669 km
- Smuggling of Bhutanese cannabis
- Insurgent camps uprooted
- BADP = OBOF [One Border One Force] under CIBMS:
- Microwave communication
- OFC [Optical Fibre Cable]
- Digital Mobile Radio
Pakistan — 3323 km
- 4 sub-borders (Radcliffe)
- LOC
- AGPL [Actual Ground Position Line]
- Drug trafficking (heroin in PB [Punjab])
- Pushes terrorists to side
- Ceasefire violation
- River water sharing
- AFSMT [?], Smart fence, CIBMS [Comprehensive Integrated Border Management System]
China — 3488 km
- Water sharing
- Border disputes
- Large-scale smuggling of Chinese electronics & other consumer goods
- [illegible] bonds
- Banni Bulle [?], India–China [?]
- Spy Cam Project
- China [illegible]
Myanmar — 1643 km
- Insurgency
- Drugs
- Pole tagna [?]
- 13 new ids [IDS points?]
- No physical barrier along border
#Way Out (SECURITYY mnemonic)
- S — Security forces (OBOF)
- E — Eco areas of border areas
- C — Coop & Joint op[erations]
- U — Upgraded surveillance
- R — Regional Intel[ligence] & Info chain
- I — [illegible]
- T — Trading points / tech
- Y — Youth engagement
- Y — [second Y — illegible]
#CIBMS [Comprehensive Integrated Border Management System]
- Madhan Gaikwad Committee
- Madhvan Gupta Committee → CIBMS
- MSPA → PA notes (MHA standard protocol to police authorities)
#Pathankot Attack (2015)
- During [Uri/Pathankot] attack (2015), terrorists entered into India through route used by drug traffickers
#Page 9 — UAPA, NIA, Drones, Bodo Peace Accord
#UAPA — Unlawful Activities (Prevention) Act
- MMA — 7→ On no. of cases (2015–19)?
- UAPA Amendments:
| Year | Key Provisions |
|---|---|
| 2004 | Scope of 'terrorist' fund, extent of interest |
| 2008 | Eco security, [illegible] add, [?] |
| 2019 | Include 4 [provision], Requirement, Approval of DG, NIA (Gaz.), DIG [or] Police |
| — | Suspension in ⅔ NIA, can control |
- Concerns:
- Unlawful act?
- No [due process]
- Risk for [?]
- [illegible]
- Judicial review:
- → Vague undefined
- → Discretionary powers
- → FR [Fundamental Rights] — 14, 19, 21 (no change [?])
- → Incommunicado [detention?]
- → Poli[tical] misuse
- → [illegible] consultation
- TADA: 1987–2004
- POTA: 2002–04 → 2R [?] consultation
#Final Solution? (J&K / Insurgency)
- Stakeholders → Board [?]
- Rect[ification of] Homeland [?] build
- Dev[elopment] of Social cap[ital]
- Transform[ation of] state and aid [civilian?]
- L&O [Law & Order] mandate
- → Sharing of lang[uage] & culture
- Problems still remain:
- ↑ to identify
- Underperception
- Tenderness
- Some factions not [integrated]
#NIA — National Investigation Agency
- NIA 2019 Amendment:
- Expand powers to [investigate] explosive substances/Act, NPA [?], Cyber [crimes], Human [trafficking?]
- Individual?
- Overruled [?]
- In session courts as spl c [special court]
#Drones
- UA [Unmanned Aircraft] — to operate w/o pilot
- Types: Remotely piloted, Auto remain[?], Model storage [?]
Applications — FAT MUD H3 (mnemonic)
- F — Agri — crop monitoring, soil health, resource util[isation]
- A — Forests — wildlife control, HVAC [?], protection (fire alerts)
- T — Urban dev — clay survey, planning, surveying/monitoring — gardening [planning?]
- M — Healthcare — epidemics control, cleaning & hygiene, quarantine enforcement
- U — Traffic mgmt — road monitoring, traffic feedback, survey
- D — Security — Real-time surveillance, security plan, map [infrastructure sites?]
- H3 — DM [Disaster Management] — search & rescue, Delivery, Real-time surveillance, hazard zoning
- — Mining — scouting [illegal], mapping
#Bodo Peace Accord — Features
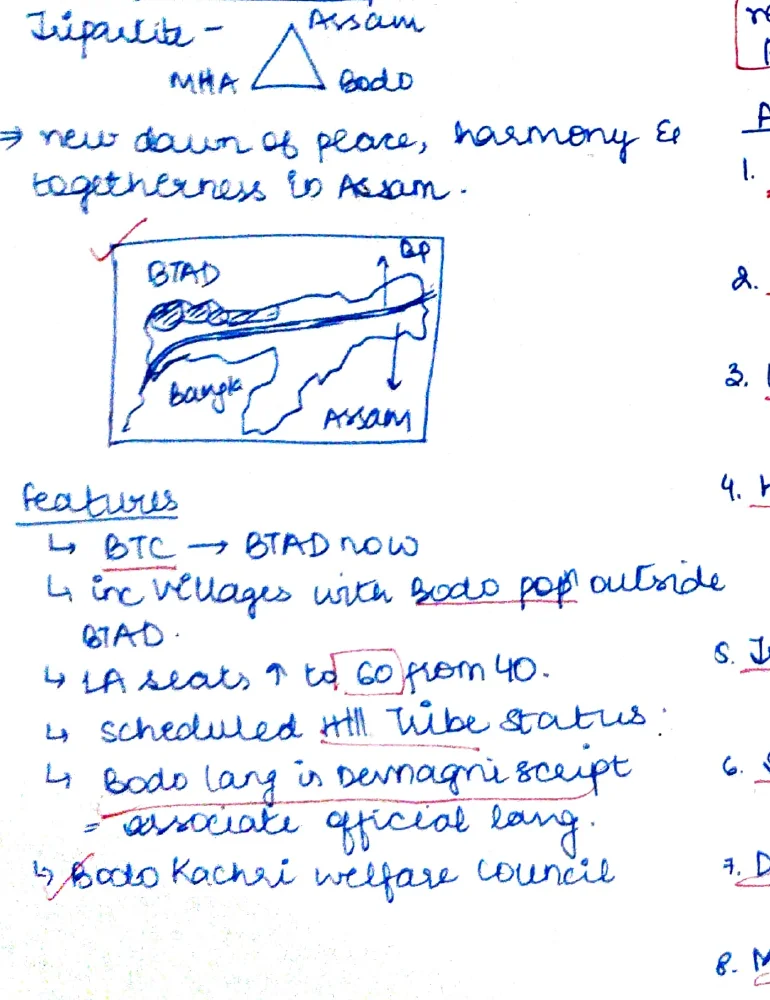
- Bodo Peace Accord
- Disputes: Assam — Bodo
- → New dawn of peace, harmony & togetherness to Assam
Features:
- BTC: [Bodoland Territorial Council] → BTC [now]
- In [the] villages with Bodo pop[ulation] outside BTC
- 4 Lok Sabha [seats — reservations]
- Scheduled — [representation in?] Scheduled Acts [legislation?]
- Board lang[uages] (Bodo) → Bodo as official lang[uage]
- Bodo Kacheri official lang[uage] Council
#Page 10 — Drones (contd.), Piracy in IOR, Bioterrorism, Integrated Theatre Command
#Drones — But (Challenges/Concerns)
- Policy gaps
- Imports
- Privacy
- Dual use tech
- Adds to traffic mgmt problems
- ↑ security threats — eg: used to drop weapons near IB border
- Surveillance
- Low flying — diff to detect
- Cheaper/smaller than conventional weapons
Anti-Drone System of DRDO
- IAF is procuring counter-UA system
- Drone Rule 2021
- Airspace map:
- Green (allowed)
- Yellow (restricted)
- Red (no-fly)
- Anti-drone tech against rogue drones like:
- Radio jammers
- GPS spoofing
- Net guns
- EM [ElectroMagnetic] pulse etc.
#Early Threat Detection Flowchart
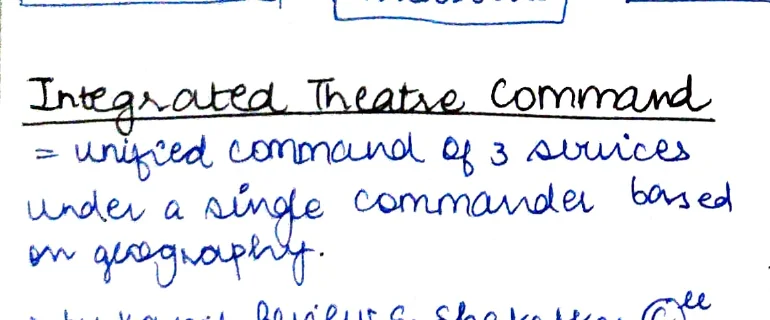
- Early threat detection + Appropriate mix of measures → Effective Deterrence
#Piracy in IOR (Indian Ocean Region)
- Map shows choke points:
- Hormuz (top right)
- Bab el-Mandeb (centre)
- Malacca [Strait]
- Mozambique
- SIOC → Choke points (circled)
- India as Observer [in maritime security fora?]
Why Piracy?
- Rich pickings at sea
- Pol instability
- 4.0 enforcement
- Poverty
Implications:
- (-) Trade hindrance
- Petro piracy
- (+) High Risk Area ↓
- (-) US not satisfied UNCLOS
- Anti-piracy patrols
- SHADE (Global Coop[eration])
- AUs Lome Charter
- BP → Puntland State, Somalia [piracy base]
#Integrated Theatre Command (ITC)
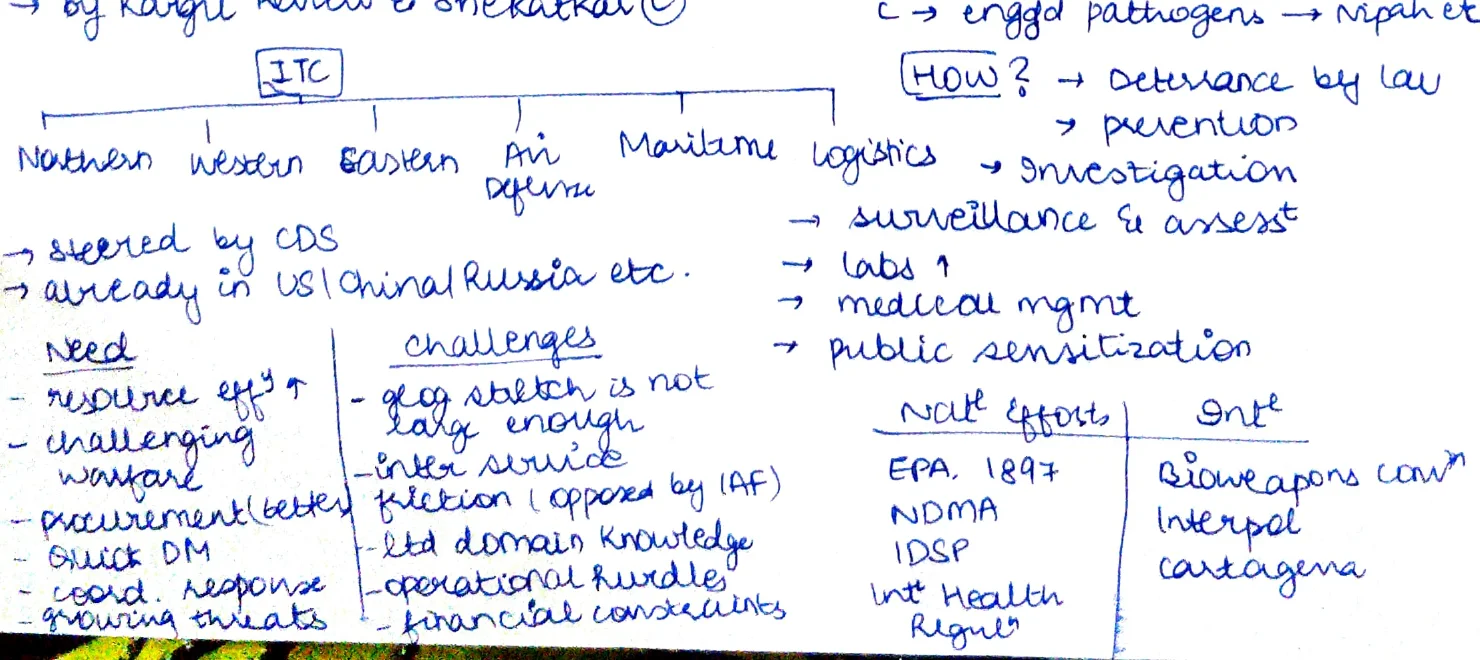
- = Unified command of 3 services under a single commander based on geography
- → By Kargil Review & Shekatkar Committee
ITC Branches:
- Northern, Western, Eastern, Air, Maritime, Logistics Defence
- Steered by CDS [Chief of Defence Staff]
- Already in US, China, Russia etc.
Need:
- Resource eff[iciency] ↑
- Challenging warfare
- Procurement [better]
- Quick DM [Decision Making]
- Coord[inated] response
- Growing threats
Challenges:
- Geo stretch is not large enough
- Inter-service friction (opposed by IAF)
- Ltd [Limited] domain knowledge
- Operational hurdles
- Financial considerations
#Bioterrorism
Need (why it matters for India):
- India's high vulnerability [to bio threats]
- Impact on society
- ↑ in attacks due to tech advancement
- New arena of warfare
Agents:
- Cat A → Quick transm[ission] → Anthrax
- B → Giardin [Giardia?]
- C → Engd[ineered] pathogens → Nipah etc.
HOW to counter?
- Deterrence by [law]
- Prevention
- Investigation
- Surveillance & assessment
- Labs ↑
- Medical mgmt
- Public sensitisation
Natl [National] Efforts:
| Instrument | Notes |
|---|---|
| EPA 1897 | Epidemic Diseases Act |
| NDMA | National Disaster Management Authority |
| IDSP | Integrated Disease Surveillance Programme |
| Intl Health Regulations | — |
International:
- Bioweapons Conv[ention]
- Interpol
- Cartagena [Protocol]